

Innovative power engineering
..pdfFig. 4. Schematic diagram of fuzzy adaptive PID control algorithm
3. Theoretical analysis and simulated analysis
Fig. 5(a) shows the two-phase flow model in heat pipe microchannel, and the heat pipe heat transfer model can be established according to two-phase flow model. Fig. 5(b) shows energy path diagram of temperature control device, which provide the basic model of temperature control system. Thus, temperature control can be realized based on these two model and intelligent control algorithms.
Tcin
Mcin
Tein
Mein
a
|
non-condenser |
Tcout |
Qc |
|
|
|
Qc |
|
PCM |
vapor |
Qs |
Qs |
Qe |
|
|
|
|
Q |
Q |
Teout |
|
fluid |
|
|
b |
|
Fig. 5. Two-phase flow model in heat pipe micro-channel (a); Energy path diagram of temperature control device (b)
221
When two-phase working fluid is at steady state:
/ |
|
, |
|
( A g -g ) .g |
|
|
|
||||
0 |
|
,z |
(1) |
||
1 |
|
||||
0 |
|
, |
( A f |
- f ) . f |
|
0 |
|
|
|||
2,z |
|
||||
At condensation section, .k 0 . Variation of steam mass is equal to total condensation mass of molecular per second, i.e. .g =.f
/ |
|
|
|
|
|
|
|
|
Pv |
|
|
|
3 |
|
|
dmv |
|
|
|
|
|
Rv2 Pv |
|
|
|
|
|
|
||||||
0.g Nv,l Rv2 |
|
|
|
|
|
|
|
|
|
|
|
|
|
|
|
|
||||||||||||||||||
m-av |
|
|
2 |
|
|
|
|
|
|
|
|
|
||||||||||||||||||||||
0 |
|
|
|
|
|
|
|
|
|
|
|
dx |
|
|
|
|
|
|
|
|
|
|
|
|
|
|
|
|||||||
|
|
|
|
|
|
|
|
|
|
|
|
|
|
|
|
2 RgTl |
|
|
|
|
|
|
||||||||||||
0 |
|
|
|
|
3kTl |
|
|
|
|
|
|
|
|
|
|
|
|
|
|
|
|
|
|
|
|
|
|
|
||||||
0- |
ac |
|
|
3R T |
|
|
|
|
|
|
|
|
|
|
|
|
3 |
|
|
|
|
|
|
|
|
(2) |
||||||||
|
|
|
|
|
|
|
|
|
|
|
|
|
|
|
|
|
|
|
|
|
||||||||||||||
1 |
|
|
m |
|
g |
l |
|
|
|
|
|
|
|
|
|
|
|
|
|
|
|
|
|
|
|
|
|
|
|
|
||||
0 |
|
|
|
|
|
|
|
|
|
|
|
|
|
d 2 ln4g |
|
|
|
R2 P |
|
|
|
|
||||||||||||
|
|
|
|
|
|
|
|
|
|
|
|
|
|
|
|
|
|
|
|
|
|
|
||||||||||||
0 |
. f mv A D |
dln4g |
|
A D |
|
|
|
|
|
|
|
|
|
|
|
v v |
|
|
|
|
||||||||||||||
|
|
|
|
|
|
|
|
|
|
|
|
|
|
|
|
|||||||||||||||||||
0 |
|
|
|
|
|
|
|
|
dx |
2 |
|
|
|
|
|
|
2 RgTl |
|
|
|
||||||||||||||
dx |
|
|
|
|
|
|
|
|
|
|
|
|
|
|
|
|||||||||||||||||||
0 |
|
|
|
|
|
|
|
|
|
|
|
|
|
|
|
|
|
|
|
|
|
|
|
|
||||||||||
2 |
|
|
|
|
|
|
|
|
|
|
|
|
|
|
|
|
|
|
|
|
|
|
|
|
|
|
|
|
|
|
|
|
|
|
Momentum conservation equation of gas phase is listed as |
||||||||||||||||||||||||||||||||||
follows: |
|
|
|
|
|
|
|
|
|
|
|
|
|
|
|
|
|
|
|
|
|
|
|
|
|
|
|
|
|
|
|
|
|
|
A |
|
,pg |
' |
|
P |
A |
|
|
gsin% - |
|
. |
|
|
|
|
, |
(m |
|
- |
|
) |
(3) |
||||||||||||
|
|
|
|
|
|
|
|
|
|
|
|
|||||||||||||||||||||||
g ,z |
|
gf gf |
|
g |
|
g |
|
|
|
|
|
g |
|
|
g |
|
|
|
,z |
g |
|
g |
|
|
|
|||||||||
Momentum conservation equation of liquid phase is listed as |
||||||||||||||||||||||||||||||||||
follows: |
|
|
|
|
|
|
|
|
|
|
|
|
|
|
|
|
|
|
|
|
|
|
|
|
|
|
|
|
|
|
|
|
|
|
A |
|
,pg |
' |
|
P |
A |
|
|
gsin% - |
|
. |
|
|
|
|
, |
(m |
|
- |
|
) |
(4) |
||||||||||||
|
|
|
|
|
|
|
|
|
|
|
|
|||||||||||||||||||||||
g ,z |
|
gf gf |
|
g |
|
g |
|
|
|
|
|
g |
|
|
g |
|
|
|
,z |
g |
|
g |
|
|
|
|||||||||
When |
boiling and condensation |
correction |
coefficient |
of heat |
||||||||||||||||||||||||||||||
transfer are used in energy conservation equation:
hb [(0.485 10 4 )(T s_evap T int_fluid) 0.07675 ( |
Cpl l |
)0.6857 T 3.291 |
]0.9287 |
(5) |
|
||||
|
|
sat |
|
|
|
kl |
|
|
|
hc 0.01074Re 2.667T 4.30 |
|
(6) |
||
sat |
|
|
||
The Reynolds number used in equation (5) can be described as follows:
222

Re 2.5872 |
4 |
2kl(T int_fluid T s_cond)d |
|
4( l v)g |
|
5 |
|||||
|
hfg |
|
|||
3 |
3 l( / l)2 |
||||
1/3
6 (7)
The Expression of evaporation and condensation heat resistance:
|
1 |
|
|
ln(do / di ) |
|
|
1 |
|
|
|||||
Revap |
|
|
|
|
|
|
|
|
|
|
(8) |
|||
h A |
|
2 kl |
h A |
|||||||||||
|
|
|
e |
e |
|
|
|
|
|
|
|
b b |
|
|
Rcond |
|
|
1 |
|
|
ln(do / di ) |
|
1 |
|
(9) |
||||
hc Ac |
|
|
|
hc Ac |
|
|||||||||
|
|
|
|
|
|
2 kl |
|
|
|
|
|
|||
When the temperature of working fluid in heat pipe is small than saturation temperature, that is to say, Tf 7 257 °C:
MCp |
dTg |
MeCp(Tin Tout) Q |
(10) |
|
|||
|
dt |
|
|
And Tg Tin Tout , Q Tg Tf mfCpf dTf
2 |
2R |
dt |
The moment when the temperature of working fluid in heat pipe is equal to 275 °C is defined as t1 :
|
MCp |
dTg |
|
MeCp(Tin Tout) Q |
(11) |
||||||||
dt |
|||||||||||||
|
|
|
|
|
|
|
|
||||||
And Tg |
Tin Tout |
, Q |
Tg Tf |
mvQlatent , Qlatent 296.4kJ / kg |
|||||||||
2 |
|
|
|
|
|
|
|
2R |
|
|
|||
|
|
|
|
|
)t2(mo ms)dt |
|
|
||||||
When Qs msQlatent , |
t1 |
|
|
|
Vs , the moment is defined as t2. |
||||||||
|
|
|
|||||||||||
|
|
|
|
|
|
|
|
|
|
|
|||
It is noted that the intelligent control system start to work when |
|||||||||||||
t 8 t2 , and Q Qc+Qs+ |
dmv |
CpvTsat , Qc is adjusted by |
intelligent |
||||||||||
|
|||||||||||||
|
|
|
|
dt |
|
|
|
|
|
||||
algorithm.
223
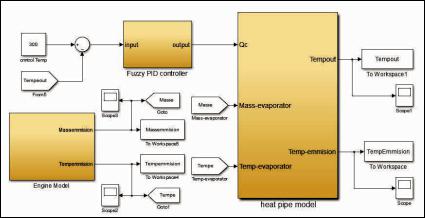
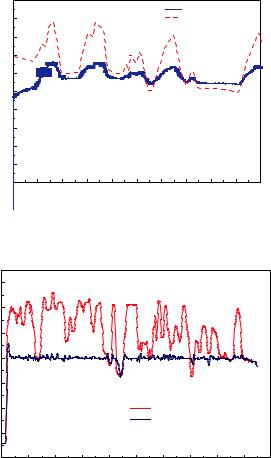
As is shown in Fig. 6, it can be found that temperature control system is consisted of three parts: exhaust temperature and mass flow provided by engine model, temperature control model and fuzzy adaptive control unit. The temperature control results can be achieved according to the preliminary simulation models, as shown in Fig. 7, when considering the cold start effect of temperature control system, the working fluid need a certain time to reach the saturation condition, thus, the outlet temperature of temperature control system is relatively low at first stage, and the decrease rate of exhaust temperature will be slow along with the increasing temperature of working fluid. It can be found from Fig. 7 that the cold start process can be finished within 25 s. Fig. 8 shows temperature control results when not considering priming effect in heat pipe, the working fluid already reach the saturation state during operating process without considering the cold start, which is contributed to the satisfactory temperature control results. It can be explained as follows: firstly, the evaporation chamber in temperature control system can effectively realize the temperature neutralize so that can reduce the temperature fluctuation; secondly, the adjustment of temperature control system is helpful to the satisfactory results.
Fig. 6. Temperature control model based on Matlab/Simulink software
224
|
500 |
|
|
|
|
|
|
|
|
|
|
|
|
|
|
|
|
|
|
temperature after control |
|
||
|
450 |
|
|
|
|
|
|
temperature before control |
|||
|
400 |
|
|
|
|
|
|
|
|
|
|
|
350 |
|
|
|
|
|
|
|
|
|
|
Temperature/ |
300 |
|
|
|
|
|
|
|
|
|
|
250 |
|
|
|
|
|
|
|
|
|
|
|
200 |
|
|
|
|
|
|
|
|
|
|
|
150 |
|
|
|
|
|
|
|
|
|
|
|
|
|
|
|
|
|
|
|
|
|
|
|
|
100 |
|
|
|
|
|
|
|
|
|
|
|
50 |
|
|
|
|
|
|
|
|
|
|
|
0 |
25 |
50 |
75 |
100 |
125 |
150 |
175 |
200 |
225 |
250 |
|
0 |
||||||||||
|
|
|
|
|
|
Time/s |
|
|
|
|
|
Fig. 7. Temperature control results when considering cold starting effect in heat pipe
|
500 |
|
|
|
|
|
|
|
|
|
|
|
450 |
|
|
|
|
|
|
|
|
|
|
|
400 |
|
|
|
|
|
|
|
|
|
|
Temperature/ |
350 |
|
|
|
|
|
|
|
|
|
|
300 |
|
|
|
|
|
|
|
|
|
|
|
250 |
|
|
|
|
|
|
|
|
|
|
|
|
|
|
|
|
|
inlet temperature of control system |
|
||||
|
|
|
|
|
|
|
outlet temperature of control system |
|
|||
|
200 |
|
|
|
|
|
|
|
|
|
|
|
150 |
100 |
200 |
300 |
400 |
500 |
600 |
700 |
800 |
900 |
1000 |
|
0 |
||||||||||
|
|
|
|
|
|
Time/s |
|
|
|
|
|
Fig. 8. Temperature control results when not considering priming effect in heat pipe
As for the control effect, it can be found that the temperature control error is within ±20 °C, meaning the exhaust temperature is near to steady state, it is contributed to simple control strategy of SCR system and small calibration workload. Fig. 9 shows NOx concentration distributions under three different conditions, the NOx
225
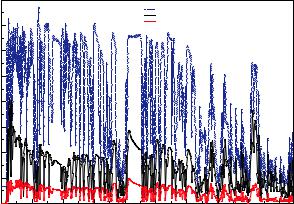
conversion efficiency can be larger than 95 % after using temperature control system, which conform to the Euro 6 emission standards.
NOx/ppm
1600
directly NOx emission
NOx emission after SCR without temperature control system
NOx emission after SCR with temperature control system
1400
1200
1000
800
600
400
200
0
0 |
100 |
200 |
300 |
400 |
500 |
600 |
700 |
800 |
900 |
Time/s
Fig. 9. NOx concentration distributions under three different conditions
4. Economic Analysis
According to market research, the price of our innovative temperature control device made to order is about 2000 Yuan and Nanjing saint carnot heat pipe company agree with our price. Average quantity of heat recycled from the controllable heat pump system is about 5 Kilo Watts. Considering the manufacturing cost and energy conservation and emission reduction of middle and heavy trucks, this price is acceptable, and the middle and heavy trucks have enough space for installing the temperature control device. Take King Long XMQ614OY8 bus (69 seats) for example, economic analysis shown in the following table, and the heat recycled from the controllable heat pump installed in the tail gas treatment system is used to heat drinking water and to drive air condition system.
According to the data from 2013 National Bureau of Statistics, the NOx emission amount of China in 2013 is 6406 kiloton, in which middle and heavy truck take account for 75.9 %, i.e. 4862 kiloton. If
226

our temperature control device can apply in middle and heavy truck, the NOx emission amount can reduce to 1519 kiloton, the calculation is listed in Table 5.
Table 3
Economic analysis of automobile exhaust using for heating drinking water
Using for heating drinking water (20–100 °C)
Electricity |
Daily demand of |
Daily power |
Annual electric |
|
consumption |
||||
drinking water (L) |
demand (kWh) |
charge (yuan) |
||
(kWh/L) |
||||
|
|
|
||
0.093 |
55 |
55*0.093=5.13 |
5.13*0.42*356=786 |
Table 4
Economic analysis of automobile exhaust using for driving air condition system
Using for driving air condition system
Output |
|
Annual |
Annual |
|
|
|
|
power of air |
Daily |
Transfer |
Annual |
Annual |
|||
operating |
energy |
||||||
condition |
working |
efficien- |
gasoline |
cost |
|||
system |
time (h) |
time |
saving |
cy |
saving (L) |
saving ( ) |
|
(day) |
(kW) |
||||||
(kW) |
|
|
|
|
|||
|
|
|
|
|
|
||
4 |
8 |
240 |
7680 |
40% |
2125 |
425 |
Table 5
NOx emission calculation after using temperature control device
Item |
China |
Using temperature |
Reduced NOx emission |
|
|
standard |
control device |
|
|
NOx conversion |
68 % |
95 % |
|
|
efficiency |
3343 kiloton |
|||
|
|
|||
NOx emission |
4862 |
1519 |
||
|
||||
amount/kiloton |
|
|||
|
|
|
227
5. Innovations and applications
Innovations: (1) Temperature is used to measure the molecular motion intensity and control temperature is typical time delay system, heat pipe with high heat flux is used as control carrier in our device, which provides new idea for temperature control; (2) It is the first time that controllable heat pipe integrated with phase change material is used in after-treatment system of automobile exhaust gas, which can realize NOx emission reduction and energy saving by effectively temperature control.
Applications: (1) In auto industry, middle and heavy diesel truck can use our innovative device to achieve high NOx conversion efficiency and energy saving; (2) In solar power station, this device can be used for peak load shifting and control steam temperature; (3) In thermal power generation, steel smelting and waste incineration process, our innovative device can reduce NOx emission and promote the green upgrade in industry.
References
1.A review on phase change energy storage: materials and applications / Mohammed M. Farida, Amar M. Khudhair, Siddique Ali K. Razack, Said AlHallaj // Energy Conversion and Management. – 2004. – Vol. 45. – P. 1597– 1615.
2.Feldman D., Shapiro M.M. Fatty acids and their mixtures as phasechange materials for thermal energy storage // Solar Energy Mater. – 1989. – Vol. 18. – P. 201–216.
3.Hasan A. Phase change material energy storage system employing palmitic acid // Solar Energy. – 1994. – Vol. 52. – P. 143–154.
4.Dimaano M., Escoto A. Preliminary assessment of a mixture of capric and lauric acid for low temperature thermal energy storage // Energy. – 1998. – Vol. 23. – P. 421–427.
5.Farid MM, Hamad FA, Abu-Arabi M. Phase change cool storage using dimethyl-sulfoxide // Energy Convers Mgmt. – 1998. – Vol. 39. – Vol. 819– 826.
6.Zuca S., Pavel P.M., Constantinescu M. Study of one dimensional solidification with free convection in infinite plate geometry // Energy Convers Mgmt. – 1999. – Vol. 40. – P. 261–271.
228
7.Leonard L. Vasiliev Review Heat pipes in modern heat exchangers // Applied Thermal Engineering. – 2005. – Vol. 25. – P. 1–19.
8.Pressure Controlled Heat Pipe Applications / William G. Anderson, John R. Hartenstine, David B. Sarraf, Calin Tarau, Kara L. Walker // 16th International Heat Pipe Conference (16th IHPC), Lyon, France, May 20–24, 2012.
9.Stoval T.K., Tomlinson J.J. What are the potential benefits of including latent storage in common wallboard? // Trans ASME. – 1995. – Vol. 117. – P. 318–325.
10.Tian Y., Zhao C.Y. A review of solar collectors and thermal energy storage in solar thermal applications // Applied Energy. – 2013. – Vol. 104. – P. 538–553.
11.ZHANG Fei, JIAN Qi-fei Waste Heat Utilization Technologies and Applications of Automobile Exhaust, 1674-3997-(2010)01-0043-03.
12.Malatidis N. Warmespeicher, insbesondere Latentwarmespeicher fur Kraftfahrzeuge: patent DE39 90 275 C 1 (1988).
229
THE CONTROL OF VERTICAL AXIS WIND TURBINE
ROTOR SPEED
E. Solomin, E. Sirotkin, S. Tchetoshnikov
South-Urals State University
The paper describes the braking device for vertical axis wind turbine. Using these devices in turbines allows preventing the destruction of the wind rotor or precluding the burning of alternator at high wind speeds (20…30 m/s). As a result of rotor rotation frequency increase up to determined limit value, the centrifugal force stretches the spring, and the cams located on the springs, contact the mast. Due to the contact of cams and mast walls the friction value controls the rotor speed. The formulas required for the development of the device, are also presented in paper. The advantages of the presented friction brake are the high reliability, simple design, low cost and durability.
Keywords: renewable energy sources, wind energy, braking systems for wind turbines.
Introduction. Lately, more and more attention paid to the problem of limited resources and environmental conditions on the ground [1]. Oil, gas and coal – all the basic raw material for the production of electricity, but each year the stock decreases. In recent decades, scientists have begun to develop such a direction as “renewable energy”, which in the future may become the basis for the production of electricity [2]. Fukushima Prefecture affected by the earthquake and tsunami in 2011, plans to switch completely to energy from renewable sources by 2040 [3] One of the main sectors of renewable energy, wind energy is based on the
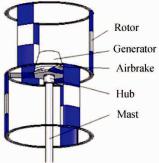
Fig. 1. Vertical Axis Wind
principle of converting the kinetic
Turbine
energy of the wind into electricity [4].
For this conversion, use so-called wind turbines. There are two types of installations: horizontal-axis and vertical-axis [5]. Most widespread in the world have the installation of horizontal axis type, but in recent years become more and more popular install vertical-axis type due to a number of advantages [6–9]. Fig. 1 shows the structure of a wind power plant with a vertical axis of rotation [8].
230