

Книги по МРТ КТ на английском языке / Magnetic Resonance Imaging in Ischemic Stroke - K Sartor R 252 diger von Kummer Tobias Back
.pdfHypoxic–Ischemic Lesions |
241 |
for hypoxic–ischemic lesions in patients with global brain ischemia or hypoxia has never been directly compared with MRI.
16.3.2
Magnetic Resonance Imaging
Unfortunately, MRI is also insensitive to early ischemia when conventional T1 and T2 sequences
are used (Fig. 16.2). Early signs of ischemia can be detected with confidence, mainly as hyperintensities on T2-weighted images (Yuh et al. 1991) not before 8–12 h after symptom onset. With the concurrent development of both faster scanners and sequences that allow echo-planar imaging (Edelman et al. 1994), the implementation of novel imaging techniques like diffusion-weighted MRI (DWI) became available (see Chap. 7) (Figs. 16.3, 16.4).
T1 |
T2 |
DWI |
Fig. 16.2. Same patient as in Fig. 16.1. On MRI, the T1-weighted images show no clear pathological findings, the T2weighted images show slight cortical hyperintensities detectable retrospectively. The diffusion-weighted images (DWI) show diffuse cortically located hyperintensities bilaterally
DWI
ADC
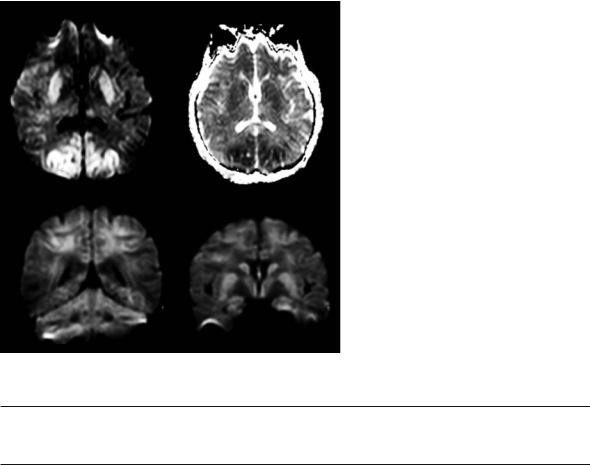
Fig. 16.3. A 42-year-old man, found comatose after cardiac arrest. On the dif- fusion-weighted images there is hyperintensity in the motor cortex bilaterally (upper row). These changes are accompanied by decreased apparent diffusion coefficient (ADC) values (lower row)
242 |
K. O. Lövblad |
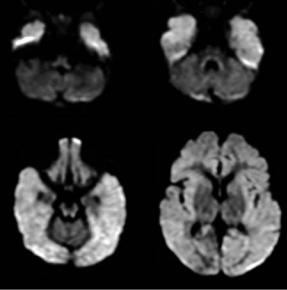
Fig. 16.4. A 6-month-old male with a Fallot tetralogy. The acute diffusion-weighted images show hyperintensities bilaterally, with sparing of the cerebellum and basal ganglia
Cortical ischemia has been studied with conventional MRI protocols (el Quessar et al. 1999; Komiyama et al. 1997, 1998; Takahashi et al. 1993; Sawada et al. 1990) where the involvement of the watershed zones in the parieto-occipito-temporal regions has been more frequently observed than elsewhere. Cerebral edema was also observed in the acute stage (Takahashi et al. 1993).
16.3.2.1
Conventional MRI (T1-, T2-Weighted MRI)
Usually T1-weighted MRI has been proposed to determine the presence of laminar cortical necrosis (Fig. 16.5): Sawada et al. (1990) observed T1 hyperintensities in the affected cortex and interpreted this finding as methemoglobin. Pathology, however, failed to show this. Histopathologically, pannecrosis is found with the death of neurons, glia and blood vessels in the affected tissue. This may result in protein degradation, which could account for the high T1 signal, as well as the possible accumulation of lipids in macrophages. T1 shortening and signal increase occur exclusively in the cortex. This suggests that the cortical necrosis is closely related to the MR signal changes. High protein concentrations or macromolecular concentration accelerate T1 relaxivity by restricting the motion of water, thus causing T1 shortening. Even a small elevation
of protein concentration may cause significant T1 shortening.
Sawada et al. (1990) performed serial radiological examinations on a patient with anoxic encephalopathy; they found high T1 signal intensity areas distributed laminarly in the cerebral cortex and diffusely in the putamen in the early term after the anoxic insult, which were thought to reflect tissue necrosis. Correlation with single photon emission CT showed persistent hypoperfusion in the arterial watershed zones. Late T2-weighted MRI revealed diffuse high-intensity lesions in the arterial watershed zones (Sawada et al. 1990). In a study of six patients with cortical necrosis, Takahashi et al. (1993) reported that involvement of the watershed zones in the parieto-occipito-temporal cortex is more frequent and more severe than that in the basal ganglia, thalami, hippocampus, pons and cerebellum. Enhanced T1-weighted images showed cortical laminar enhancement in the early subacute stage; unenhanced T1-weighted images revealed characteristic laminar hyperintense lesions of the cerebral cortex in the late subacute stage. Both of these findings seemed to reflect the progression of cortical laminar necrosis. In the chronic stage, cortical atrophy and delayed but progressive white matter changes were seen (Takahashi et al. 1993).
Komiyama et al. (1997) studied patients with stroke and cortical necrosis by MRI and found that in 13 patients laminar cortical lesions began to appear on T1-weighted images about 2 weeks after the ictus. At 1-2 months they were prominent (Komiyama et al. 1997). They further studied 16 patients with laminar cortical necrosis by conventional MR sequences (T1-weighted, T2-weighted, FLAIR) and confirmed that high intensity cortical lesions were visible on the T1-weighted images from 2 weeks after ictus and became prominent at 1–3 months, then became less apparent, but occasionally remained at high intensity for 2 years. High intensity cortical lesions on FLAIR images became prominent from 1 month, and then became less prominent from 1 year ownward, but occasionally remained at high intensity for 2 years. Subcortical lesions did not display high intensity on T1-weighted images at any stage. On FLAIR images, subcortical lesions initially showed slightly high intensity and then low intensity from 6 months onward due to encephalomalacia (Komiyama et al. 1998).
In a study of six patients with laminar cortical necrosis, MRI showed hyperintense lesions in the cerebral cortex on T1-weighted and T2-weighted images (el Quessar et al. 1999). In four patients,
Hypoxic–Ischemic Lesions |
243 |
a |
b |
|
|
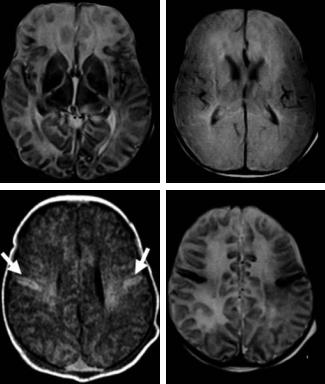
Fig. 16.5a–d. The late imaging shows diffuse cortical |
|
|
|
necrosis seen as areas of hyperintensity on T2-weighted |
|
|
|
imaging (a, d). Proton density image is shown in (b). |
|
c |
d |
There are also the typical T1-weighted hyperintensi- |
|
ties in the parietal cortex bilaterally (arrows, c) |
|||
|
|
cortical laminar necrosis was caused by ischemic stroke, one insult occurred after a cardiac arrest and the last patient had a meningoencephalitis. The time delay from insult to the first MR study varied between 1 week and 3 months. The high intensity signal was still observed a few months after the insult. Cortical laminar necrosis lesions did not demonstrate hemorrhage on CT and MRI studies (el Quessar et al. 1999). Christophe et al. (1994) reported on four patients illustrating the early depiction of multiple types of neuropathologic lesions, which may coexist in the full-term newborn following severe hypoxic– ischemic encephalopathy. They demonstrated the presence of diffuse, postnatal involvement of cerebral cortex and subcortical white matter. They thought that cortical hyperintensity on both proton densityand T1-weighted images are probably related to cellular diffusely or parasagittally distributed necrosis. Hyperintense white matter on proton density-weighted images may result from increased water concentration due to infarct or edema, like low intensity on T1-weighted images and high intensity on T2-weighted images. On follow-up MRI several months later, lesions detected during the postnatal period were converted into cortical atrophy and myelination delay (Christophe et al. 1994). Christophe et al. (2002) also studied 40 children
with hypoxic coma and found a strong correlation between first MRI score and neurological outcome (Christophe et al. 2002). The sensitivity of the first MRI score for clinically relevant ischemic lesions was high (96%), even when obtained during the first 3 days, with a specificity of 50% and a positive predictive value of 82%.
16.3.2.2 Diffusion-Weighted MRI
Diffusion-weighted MRI, due to its extreme sensitivity to changes in tissue water and, therefore, to ischemia (Le Bihan et al. 1986; Moseley et al. 1990; van Gelderen et al. 1994; Warach et al. 1992, 1995; Sorensen et al. 1996; Lövblad et al. 1998), makes it possible to demonstrate ischemic changes due to acute hypoperfusion (see Chap. 7). These findings correspond to those found in the early stages of laminar cortical necrosis (Figs. 16.3, 16.6, 16.7).
In a study of 12 patients with postresuscitation encephalopathy, the presence of high signal intensity regions in the bilateral cerebral cortex was the earliest finding (at less than 24 h) on DWI (Goto et al. 2001). Similar abnormality of bright high signal areas in FLAIR and T2 images followed in the early
244 |
K. O. Lövblad |
DWI |
DWI |
ADC |
T2 |
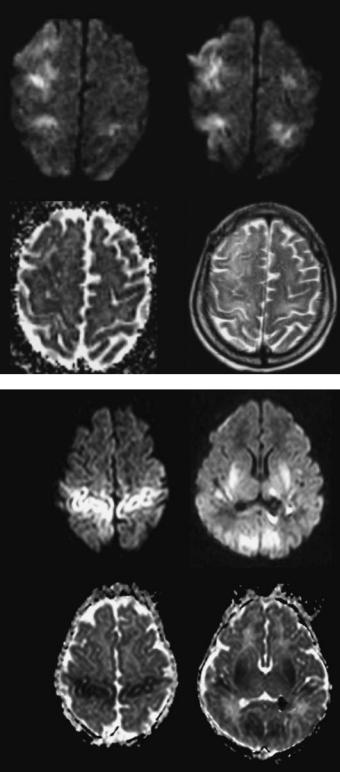
Fig. 16.6. A 55-year-old man with bradycardia. The diffusion-weighted imaging (DWI, top row) shows bilateral hyperintensities in the frontal cortex, accompanied by decreased ADC values (left bottom). The changes are slightly visible on T2 images (right bottom)
DWI
ADC
Fig. 16.7. A 15-day-old child with cardiac arrest and coma. The DWI images show bilateral hyperintensities in the cortex and white matter (top row), associated with decreased ADC values (bottom row)
subacute period (1-13 days). Subsequently, white matter was involved and laminar necrosis in cortical area was observed in the late subacute period
(14-20 days). Finally, diffuse brain atrophy and an obscuration of the gray-white matter junction was seen in the chronic stage (after 21 days) (Goto et

Hypoxic–Ischemic Lesions |
245 |
al. 2001). The MRI findings closely correlated with poor clinical outcomes. The author saw two patients who had developed cortical necrosis following some form of immunotherapy – in one case it occurred following renal transplant rejection and in the second patient it was intoxitation by FK-506 (Lövblad et al. 2004). These findings confirm those of Bargallo et al. (2000) who reported a patient who developed similar MRI findings after immunosuppressive therapy, suggesting a hypoxic mechanism in these patients. Takeoka et al. (2002), in a series of eight newborns with neonatal hypoxic injury, found that the distribution of DWI abnormalities was consistent with the type of global hypoxic–ischemic injury usually found in full-term neonates with diffuse cortical necrosis, borderzone infarcts, or basal ganglia/thalamic injury. They also found that in each patient, standard MRI sequences substantially underestimated the extent of injury when compared with diffusionweighted images in neonatal brains (Takeoka et al. 2002). They observed that extensive injury bilateral with basal ganglia, thalamic, and widespread multifocal cortical involvement correlated with poor neurological outcome. They also showed that lesser degrees of injury, limited to smaller sectors of cortical or borderzone involvement, were associated with better neurological outcome.
Using DWI to evaluate patterns of ischemic changes in anoxic brain injury, Singhal et al. (2002) studied clinical and DWI features of three patients with different types of anoxic brain injury: attempted hanging, carbon monoxide poisoning (hypoxic hypoxia), and hanging with cardiac arrest (hypoxic–ischemic encephalopathy). The first two patients, but not the third, recovered substantial neurological function. The distribution of DWI abnormalities was different and correlated well with the distinct neuropathological features of these entities. The prognosis after anoxic encephalopathy depends on the underlying mechanism and its severity, which may be reflected by DWI abnormalities. The two patients with less severe forms of hypoxic injury survived whereas the patient with a combination of hypoxia and ischemia died. They found that hyperintensity throughout the cerebral cortex was in favor of diffuse hypoxia with ischemia, whereas DWI hyperintensities restricted to the thalamus and selected cortical regions suggested primary milder hypoxic injury (Singhai et al. 2002). Hald et al. (2003) reported on a 16-year-old man after a suicide attempt who had normal initial DWI 5-6 h after the event, but pathological findings at 3 days. They were unable to entirely explain the initial normal findings on DWI (Hald et al. 2003).
Table 16.1. Clinical data of 26 patients with global cerebral hypoxia/ischemia
|
Age* |
Gender |
Underlying cause |
Time |
Outcome |
T2 |
T1 |
1 |
20 |
M |
Marijuana abuse |
12 h |
Death |
0 |
0 |
2 |
79 |
F |
Cardiac disease |
24 h |
Death |
0 |
0 |
3 |
2 days |
M |
Cardiac arrest |
20 h |
Death |
0 |
0 |
4 |
58 |
F |
Cardiac arrest |
15 h |
Death |
0 |
0 |
5 |
8 months |
M |
Cardiac operation |
7 days |
Disabled |
+ |
- |
6 |
51 |
M |
Renal transplant |
7 days |
Death |
+ |
- |
7 |
55 |
M |
Bradycardia |
6 days |
Disabled |
- |
0 |
8 |
44 |
M |
Cardiac arrest |
5 days |
Death |
- |
0 |
9 |
4 |
F |
ARDS |
8 days |
Death |
- |
0 |
10 |
57 |
M |
Barbiturate intoxication |
12 h |
Death |
0 |
0 |
11 |
81 |
M |
Stroke |
10 days |
Disabled |
+ |
- |
12 |
8 |
M |
Cardiac arrest |
5 days |
Death |
- |
0 |
13 |
66 |
M |
Tacrolimus intoxication |
7 days |
Death |
- |
0 |
14 |
51 |
M |
Arrhythmia |
12 h |
Disabled |
0 |
0 |
15 |
9 days |
M |
Cardiac arrest |
5 days |
Disabled |
- |
0 |
16 |
12 |
M |
Hanging |
2 days |
Death |
- |
0 |
17 |
44 |
M |
Cardiac arrest |
36 h |
Death |
- |
0 |
18 |
70 |
M |
Cardiac arrest |
15 h |
Disabled |
- |
0 |
19 |
52 |
M |
Cardiac arrest |
20 h |
Death |
- |
0 |
20 |
57 |
F |
Cardiac arrest |
2 days |
Death |
+ |
0 |
21 |
44 |
F |
Cardiac arrest |
24 h |
Death |
- |
0 |
22 |
42 |
M |
Cardiac arrest |
3 days |
Disabled |
+ |
- |
23 |
25 days |
M |
Cardiac arrest |
2 days |
Death |
+ |
+ |
24 |
53 |
M |
Cardiac arrest |
10 h |
Disabled |
- |
- |
25 |
46 |
M |
Cardiac arrest |
2 days |
Death |
+ |
- |
26 |
35 |
F |
Intracranial hemorrhage |
12 days |
Death |
+ |
+ |
ARDS, acute respiratory distress syndrome; time, time between onset of symptoms and MRI; T2,T1, 0: normal findings; + equivalent to diffusion-weighted MRI; - less extensive changes than suspected on DWI alone * in years if not stated otherwise
246
The author examined comatose patients with suspected cortical ischemia with DWI who had suffered from cerebral hypoxia often after cardiac arrest (Lövblad et al. 2004). A further evaluation of an expanded series of these patients is presented in Table 16.1 26 patients with lesions attributed to hypoxia that resumes the clinical signs of all patients. This series confirms the initial observation that DWI was superior to T2-weighted MRI regarding the prediction of lesion extent. Table 16.2 presents the patterns and localizationof findings. The DWI lesions were localized in the typical watershed regions in 7 of 26 (27%) (Fig. 16.8). The cortical lesions were unilateral in one patient (4%). Basal ganglia involvement was found in 10 of 26 patients (38%), and there was also white matter involvement in 9 of 26 patients (35%) (Figs. 16.8 and 16.9). Additional infratentorial lesions were found in 3 of 19 patients (35%) (Fig. 16.8).
When comparing the diffusion images to the standard T2-weighted images, the diffusion lesions were more extended in 12 patients (46%), DWI detected lesions not seen in another six patients (T2 negative: 23%; Fig. 16.2) and in only 8 of 26 (31%), patients’ T2-weighted imaging confirmed the DWI findings (results equal for DWI and T2weighted imaging). This finding was also observed by Arbalaez et al. (1999) who found that during the acute period, DWI showed the abnormal basal
K. O. Lövblad
Table 16.2. Diffusion-weighted imaging findings in 26 cases of cerebral hypoxic–ischemic lesions
Localization
Supratentorial (biand unilateral) |
26/26 |
100% |
Bilateral diffuse |
22/26 |
085% |
Bilateral focal |
03/26 |
011% |
Unilateral |
01/26 |
004% |
+Infratentorial |
04/26 |
018% |
Watershed type |
07/26 |
027% |
Basal ganglia involvement |
10/26 |
038% |
White matter involvement |
09/26 |
035% |
|
|
|
ganglia, cerebellum, and cortex to a better extent than conventional MR images (Arbelaez et al. 1999).
Of the 26 patients, 19 did not survive; the demised patients had bilateral involvement of the cortex, as well as some degree of involvement of the white matter (9 patients) and basal ganglia (10 patients). Five patients survived with severe disabilities. They did not have white matter or basal ganglia involvement. Based on these MR images obtained in patients with hypoxic-ischemic lesions, it was possible to establish a grading of the DWI findings (Table 16.3), ranging between 1 and 4. All five patients who survived belonged to grades 1 and 2. Patients in grades 3 and 4 all died.
The association of white matter lesions seems to contribute to morbidity. Cortical laminar changes on MRI without concomitant white matter abnormali-
DWI |
T2 |
FLAIR |
FLAIR |
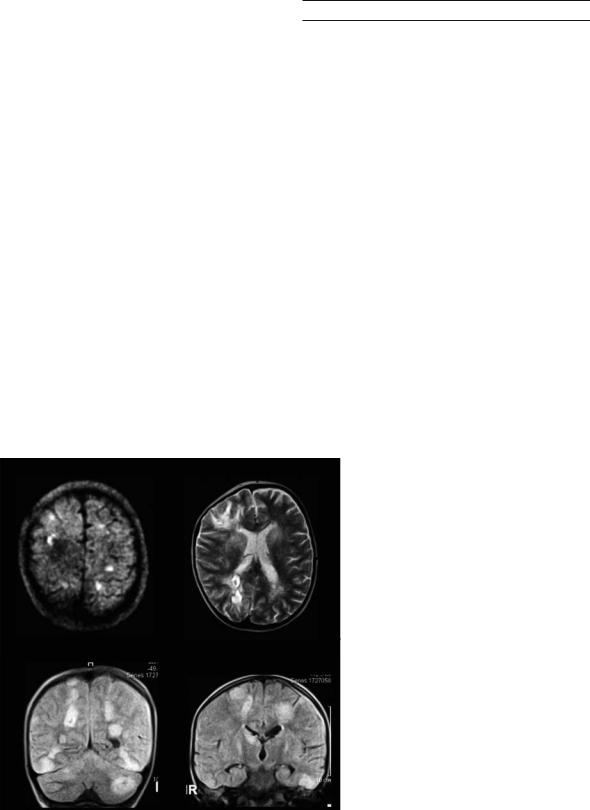
Fig. 16.8. A 4-year-old girl with leukemia suffering from acute respiratory distress syndrome. On DWI there are bilateral hyperintensities partly seen on the T2-weighted and FLAIR images. The lesions affect the cortex, the basal ganglia, the white matter as well as the cerebellum
Hypoxic–Ischemic Lesions |
247 |
DWI |
ADC |
DWI |
DWI |
Fig. 16.9. A 44-year-old lady found comatose after cardiac arrest. Bilateral hyperintensities on diffu- sion-weighted images (DWI) are present in the cortex. There are also hyperintensities in the basal ganglia and subcortical white matter with associated diminished ADC values (right top), best seen
Table 16.3. Grading of diffusion-weighted MR imaging (DWI) findings in global cerebral hypoxia/ischemia.
Grade 1: DWI hyperintensities in the fronto-parieto-occipital cortex
Grade 2: DWI hyperintensities in the fronto-parieto-occipital cortex and basal ganglia
Grade 3: DWI hyperintensities in the fronto-parieto-occipital cortex, basal ganglia and supratentorial white matter Grade 4: DWI hyperintensities in the fronto-parieto-occipital cortex, basal ganglia, white matter and cerebellum
ties was associated with an increased risk of spasticity in children (van der Knaap et al. 1993). In children with white matter lesions, cortical laminar abnormalities did not contribute to the risk of spasticity, which was already highly increased by the presence of white matter damage (van der Knaap et al. 1993).
Laminar necrosis is a rare manifestation of neuronal injury with a very poor prognosis. Laminar necrosis often follows hypotension of relatively slow onset but of long duration. The process thus results from oxygen or glucose depletion caused by anoxia, hypoglycemia, status epilepticus, or ischemic stroke. Most of our patients had some form of circulatory failure.
DWI has the clear advantage that it shows acute changes due to anoxia leading to laminar necrosis. It does not show the subsequent infiltration of lipidfilled macrophages, the imaging correlate of which is potentially seen on T1-weighted images. These findings do, however, appear later on. High-signal cortical lesions began to appear about 2 weeks after the ictus, were prominent at 1-2 months, then became less evident, but occasionally remained for up to
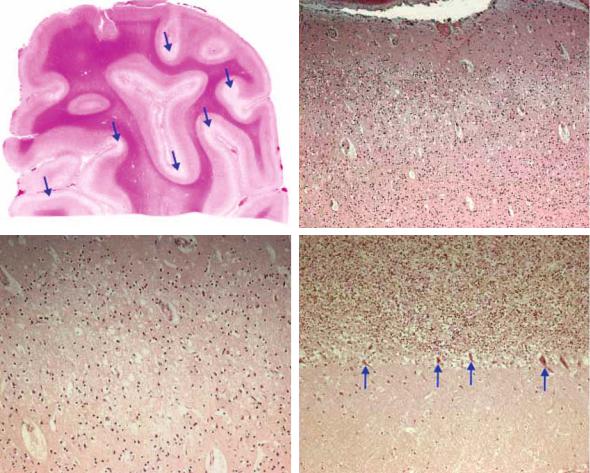
1.5 years (Siskas et al. 2003). T1-weighted changes may correspond to a variety of causes as described by Boyko et al. (1992). The correlation between imaging abnormalities and neuropathological findings could be established in a case presented in Figs. 16.10 and 16.11. In this patient, a severe intoxication had lead to diffuse cortical necrosis both in the neocortex and cerebellar cortex accompanied by widespread neuronal damage (Fig. 16.10).
The findings in all these clinical series are confirmed by those of Kawahara et al. (2000) who found in both animal models and in humans that diffusion-weighted images show hyperintensity with associated drops on the ADC maps. On histopathological correlation, they found microvacuolation in the pyramidal neurons in the CA1 region; at 1 week, the hyperintensity in diffusion-weighted images had disappeared and microvacuolation had also disappeared in the CA1 region, but severely disrupted pyramidal neurons containing pyknotic nuclei had appeared in the CA1 region (Kawahara et al. 2000).
248 |
K. O. Lövblad |
a |
b |
c |
d |
Fig. 16.10a–d. A 66-year-old man found comatose after severe intoxication. The neuropathological findings show: diffuse cortical necrosis (recent, a); the arrows indicate that edema predominates in the depth of the sulci. There are shrunken neurons with eosinophilic cytoplasm and pyknotic nuclei (b, c). The cerebellar cortex shows shrunken necrotic Purkinje cells (d)
16.4 |
weighted imaging. The data suggest that more exten- |
Conclusions |
sive cortical lesions with supplemental lesions in the |
|
white matter and/or posterior fossa have a worse |
In comparison to conventional images provided by |
prognosis (Lövblad et al. 2004; van der Knaap et |
MRI and CT, DWI provides an improved sensitivity |
al. 1993; Christophe et al. 2002). For the moment, |
for the lesion extent in patients with cerebral lesions |
MRI and DWI will remain an indispensable adjunct |
due to hypoxic and hypoxic–ischemic events. This |
to the clinical examination and electrophysiology |
was also observed by Arbalaez et al. (1999) who |
even if its exact role in the forensic management has |
found that during the acute period, DWI showed the |
still to be established with certainty. |
abnormal basal ganglia, cerebellum, and cortex to a |
|
better extent than conventional MR images. There- |
Acknowledgements |
fore, based on the existing literature, we believe |
We thank Dr G.P. Pizzolato for providing us with |
that DWI can help in identifying and classifying the |
the neuropathological examinations and figures. |
extent of ischemia in patients with global ischemia- |
We thank Dr J. Delavelle for her invaluable help with |
hypoxia by giving us an in vivo appraisal of ongoing |
the evaluation of the data. Philippe Camarassa pro- |
pathophysiological changes. It is also evident that the |
vided the invaluable photography. Dr A. Alimenti |
earlier the imaging is performed, the more sensitive |
provided help with evaluation of the DWI data. Dr |
DWI is for detecting ischemic changes not seen on T2- |
Lövblad was supported by a grant from the Swiss |
Hypoxic–Ischemic Lesions |
249 |
DWI |
ADC |
PD |
T1 |
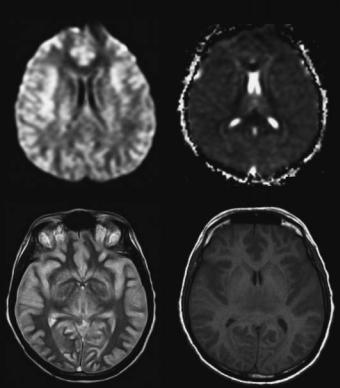
Fig. 16.11. Neuroimaging of the case above (Fig. 16.10) showed diffuse hyperintensity on DWI of both cerebral hemispheres (white brain), affecting all components; cortex, basal ganglia and white matter. There is an associated decrease in the (ADC). The T1 images and (PD) images are also altered with signs of edema
National Foundation, Grant No. 3100-066348.01 “Mapping the ischemic tissue at risk with diffusion and perfusion MRI”.
References
Arbelaez A, Castillo M, Mukherji SK (1999) Diffusion-weighted MR imaging of global cerebral anoxia. Am J Neuroradiol 20:999–1007
Bargallo N, Burrel M, Berenguer J, Cofan F, Bunesch L, Mercader JM (2000) Cortical laminar necrosis caused by immunosuppressive therapy and chemotherapy. Am J Neuroradiol 21:479–484
Boyko OB, Burger PC, Shelburne JD, Ingram P (1992) Nonheme mechanisms for T1 shortening: pathologic, CT, and MR elucidation. Am J Neuroradiol 13:1439–1445
Christophe C, Clercx A, Blum D, Hasaerts D, Segebarth C, Perlmutter N (1994) Early MR detection of cortical and subcortical hypoxic-ischemic encephalopathy in full-term- infants. Pediatr Radiol 24:581–584
Christophe C, Fonteyne C, Ziereisen F, Christiaens F, Deltenre P, de Maertelaer V et al (2002) Value of MR imaging of the brain in children with hypoxic coma. Am J Neuroradiol 23:716–723
Edelman RR, Wielopolski P, Schmitt F (1994) Echo-planar MR imaging. Radiology 192:600–612
El Quessar A, Meunier JC, Delmaire C, Soto Ares G, Pruvo JP (1999) MRI imaging in cortical laminar necrosis. J Radiol
80:913–916
Gillard JH, Papadakis NG, Martin K, Price CJ, Warburton EA, Antoun NM et al (2001) MR diffusion tensor imaging of white matter tract disruption in stroke at 3 T. Br J Radiol 74:642–647
Gorelick PB, Kelly MA (1993) Neurological complications of cardiac arrest. In: Vinken PJ, Bruyn GW, Klawans HL (eds) Handbook of clinical neurology, vol 19(63): systemic diseases, part 1. Elsevier, Amsterdam, pp 205–227
Goto Y, Wataya T, Arakawa Y, Hojo M, Chin M, Yamagata S et al (2001) Magnetic resonance imaging findings of postresuscitation encephalopathy: sequential change and correlation with clinical outcome. No To Shinkei 53:535–540
Hald JK, Brunberg JA, Dublin AB, Wootton-Gorges SL (2003) Delayed diffusion-weighted MR abnormality in a patient with an extensive acute cerebral hypoxic injury. Acta Radiol 44:343–346
Hawes DR, Mishkin FS (1972) Brain scans in watershed infarction and laminar cortical necrosis. Radiology 103:131–134
Kawahara H, Takeda Y, Tanaka A, Nagano O, Katayama H, Hirakawa M, Hiraki Y (2000) Does diffusion-weighted magnetic resonance imaging enable detection of early ischemic change following transient cerebral ischemia? J Neurol Sci 181:73–81
Komiyama M, Nishikawa M, Yasui T (1997) Cortical laminar necrosis in brain infarcts: chronological changes on MRI. Neuroradiology 39:474–479
Komiyama M, Nakajima H, Nishikawa M, Yasui T (1998) Serial MR observation of cortical laminar necrosis caused by brain infarction. Neuroradiology 40:771–777
250
Le Bihan D, Breton E, Lallemand D, Grenier P, Cabanis E, Laval-Jeantet M (1986) MR imaging of intravoxel incoherent motions: application to diffusion and perfusion in neurologic disorders. Radiology 161:401–407
Lövblad KO, Laubach HJ, Baird AE, Curtin F, Schlaug G, Edelman RR et al (1998) Clinical experience with diffusionweighted MR in patients with acute stroke. Am J Neuroradiol 19:1061–1066
Lövblad KO, Bassetti C (2000) Diffusion-weighted magnetic resonance imaging in brain death. Stroke 31:539–542
Lövblad KO, Wetzel SG, Somon T, Wilhelm K, Mehdizade A, Kelekis A, El-Koussy M et al (2004) Diffusion-weighted MR imaging in cortical ischemia. Neuroradiology 46:175–182
Moseley ME, Cohen Y, Mintorovitch J, Chileuitt L, Shimizu H, Kucharczyk J et al (1990) Early detection of regional cerebral ischemia in cats: comparison of diffusionand T2-weighted MRI and spectroscopy. Magn Reson Med 14:330–346
Sawada H, Udaka F, Seriu N, Shindou K, Kameyama M, Tsujimura M (1990) MRI demonstration of cortical laminar necrosis and delayed white matter injury in anoxic encephalopathy. Neuroradiology 32:319–321
Schlaug G, Siewert B, Benfield A, Edelman RR, Warach S (1997) Time course of the apparent diffusion coefficient (ADC) abnormality in human stroke. Neurology 49:113–119
Singhal AB, Topcuoglu MA, Koroshetz WJ (2002) Diffusion MRI in three types of anoxic encephalopathy. J Neurol Sci 15:37-40
Siskas N, Lefkopoulos A, Ioannidis I, Charitandi A, Dimitriadis AS (2003) Cortical laminar necrosis in brain infarcts: serial MRI. Neuroradiology 45:283–288
Sorensen AG, Buonano FS, Gonzalez RG, Schwamm LH, Lev MH, Huang-Hellinger FR et al (1996) Hyperacute stroke: evaluation with combined multisection diffusion-weighted and hemodynamically-weighted echo-planar MR imaging. Radiology 199:391–401
K. O. Lövblad
Takahashi S, Higano S, Ishii K, Matsumoto K, Sakamoto K, Iwasaki Y et al (1993) Hypoxic brain damage: cortical laminar necrosis and delayed changes in white matter at sequential MR imaging. Radiology 189:449–456
Takeoka M, Soman TB, Yoshii A, Caviness VS Jr, Gonzalez RG, Grant PE et al (2002) Diffusion-weighted images in neonatal cerebral hypoxic-ischemic injury. Pediatr Neurol 26:274–281
Toole JF, Burrow DD (1990) Pathophysiology and clinical evaluation of ischemic vascular disease. In: Youmans JR (ed) Neurological surgery, 3rd edn, vol 3. Saunders, Philadelphia, pp 1463-1515
Valanne L, Paetau A, Suomalainen A, Ketonen L, Pihko H (1996) Laminar cortical necrosis in MELAS syndrome: MR and neuropathological observations. Neuropediatrics 27:154–160
Van der Knaap MS, Smit LS, Nauta JJ, Lafeber HN,Valk J (1993) Cortical laminar abnormalities–occurrence and clinical significance. Neuropediatrics 24:143–148
Van Gelderen P, de Vleeschouwer MHM, DesPres D, Pekar J, van Zijl PCM, Moonen CTW (1994) Water diffusion and acute stroke. Magn Reson Med 31:154–163
Von Kummer R, Bourquain H, Bastianello S, Bozzao L, Manelfe C, Meier D et al (2001) Early prediction of irreversible brain damage after ischemic stroke at CT. Radiology 219:95–100
Warach S, Chien D, Li W, Ronthal M, Edelman RR (1992) Fast magnetic resonance diffusion-weighted imaging of acute stroke. Neurology 42:1717–1723
Warach S, Gaa J, Siewert B, Wielopolski P, Edelman RR (1995) Acute human stroke studies by whole brain echo planar diffusion-weighted magnetic resonance imaging. Ann Neurol 37:231–241
Yuh WT, Crain MR, Loes DJ, Greene GM, Ryals TJ, Sato Y (1991) MR imaging of cerebral ischemia: findings in the first 24 hours. Am J Neuroradiol 12:621–629