

Книги по МРТ КТ на английском языке / MR Imaging in White Matter Diseases of the Brain and Spinal Cord - K Sartor Massimo Filippi Nicola De Stefano Vincent Dou
.pdf104 |
|
|
|
|
|
|
|
|
|
|
|
P. Jezzard and A. Toosy |
|
|
|
|
|
|
|
|
|
|
|
|
Fig. 8.11a, b. Representation of a block |
|
|
|
|
|
|
|
|
|
|
|
|
|
stimulus |
|
|
|
|
|
|
|
|
|
|
design fMRI paradigm (a), and an event- |
|
|
|
|
|
|
|
|
related fMRI paradigm (b). For the block |
|||||
|
|
|
|
|
|
|
|
|
|
|
|
|
|
|
|
|
|
|
|
|
|
|
|
|
design a relatively long (20–30 s) stimu- |
|
|
|
|
|
|
|
|
|
|
|
|
|
sampling |
|
|
|
|
|
|
|
|
|
|
|
lation period is alternated with a control |
x x x x x x x x x x x x x x x x x |
x x x x x x x x x x x x x x x x |
period. For the event-related design a |
||||||||||
|
|
|
|
|
|
|
|
|
|
|
|
brief stimulus period is used, which can |
|
|
|
|
|
|
|
|
|
|
|
|
either be periodic or randomized. The |
BOLD signal |
|
|
|
|
crosses indicate the acquisition of vol- |
|||||||
|
|
|
|
umes of MRI data. The lower curves in |
||||||||
a |
|
|
|
|
|
|
|
|
|
|
|
|
|
|
|
|
|
|
each panel indicate the predicted hae- |
||||||
|
|
|
|
|
|
|||||||
|
|
|
|
|
|
|
|
|
|
|
|
|
|
|
|
|
|
|
|
|
|
|
|
|
modynamic response and are generated |
|
|
|
|
|
|
|
|
|
|
|
|
by convolving the stimulus input func- |
|
|
|
|
|
|
|
|
|
|
|
|
tion with a model of the instantaneous |
|
|
|
|
|
|
|
|
|
|
|
|
haemodynamic response function. |
stimulus |
|
|
|
|
|
|
|
|
|
|
|
|
|
|
|
|
|
|
|
|
|
|
|
||
|
|
|
|
|
|
|
|
|
|
|
|
|
sampling |
x x x x x x x x x x x x x x x x x |
x x x x x x x x x x x x x x x x |
|
|||||||||
BOLD signal
b
visual
auditory
time
Fig. 8.12. Block design fMRI experiment showing an overlapping paradigm consisting of visual and auditory stimulation epochs. The visual stimulus consisted of a flickering checkerboard (8 Hz frequency) shown for 30 s alternated with 30-s display of a fixation cross. The auditory stimulus consisted of recorded speaking voices for 45 s alternated with 45 s of rest. A combined analysis was applied to reveal the visual (yellow–red) and auditory (green–blue) processing areas of the brain. (Data provided by the FMRIB Centre, University of Oxford, with permission.)
It is also possible to design tasks that modulate a particular functional process, such that it can be detected via a parametric analysis. An example might be to perform sustained periods of motor activity (hand flexion, finger opposition, etc.), but with each stimulus epoch performed at a different level of task difficulty. The analysis of the data then seeks those areas of the brain that show a graded response to the task level.
8.4.2
Event-Related Designs
It is not always appropriate or physiologically feasible to sustain certain stimulus types for an extended period. Such an example might be the application of a brief painful stimulus. Further, there may be a need to introduce an element of unpredictability into the stimulus presentation, for example to avoid

Functional MRI |
105 |
confounds of an anticipatory response. In these cases one approach that can be adopted is the use of a socalled “event-related” design (Buckner 1998). This is shown schematically in Fig. 8.11b, in which a series of brief stimuli are presented, perhaps at regular intervals or perhaps at random intervals. It is implicit that a fast imaging sequence be used (2–3 s volume-to- volume interval), since the haemodynamic responses to be characterized are also relatively brief (6–12 s). The data are then analysed for brain areas that show a time-course signature that correlates with the predicted haemodynamic response (also shown in Fig. 8.11b). It should be noted that event-related designs are more sensitive to the details of the haemodynamic response model used (see below) than are block designs. In this sense block designs are more robust, since a sustained cognitive state can be modelled, and hence a sustained (and simple) haemodynamic response can be assumed. In contrast, analysis of event-related designs may produce poor results if an inaccurate haemodynamic response function is assumed. This may be all the more the case if the interval between successive stimuli becomes short, or if widely distributed brain areas are of interest, in which case it may be necessary to model a set of area-specific haemodynamic response functions. Nevertheless, event-related designs have proved their use when short-duration stimuli are required.
8.5
Data Analysis Strategies
With the advent of well-packaged analysis programs, and with the introduction of scanners with on-board fMRI analysis, it is becoming less essential to have comprehensive knowledge regarding analytical methods for processing fMRI data. Nevertheless, it should be a high priority to any serious clinician or researcher to appreciate what is being performed within the “black box”. Only a brief summary is provided here, but a more lengthy discussion of the details of fMRI data analysis can be found in the book by Jezzard et al. (2001).
8.5.1
Pre-Statistics Procedures
In most fMRI analysis packages a number of steps are first taken to improve the quality of the underlying data, or to otherwise “encourage” the data to conform
to the set of assumptions behind a particular statistical model. One important first step is to attempt to correct the time-course data for motion artefacts associated with subject movement. Usually this requires an algorithm that performs a rigid body transformation in order to register successive volumes. Many sites also perform a slice timing correction that attempts to account for the fact that the different slices that comprise a volume are not actually collected simultaneously.
The other principal processing step that is often applied to the data is to perform filtering operations that attempt to improve the conformity of the data to assumptions that are subsequently used during statistical inference. In particular, many packages apply a spatial blurring in order to improve the confidence that the images have a particular point spread function (i.e. a known spatial correlation). Typically the spatial filter that is applied is only marginally wider than the digital (pixel) resolution itself. But in some cases more severe filtering is applied. The advantage of substantial spatial filtering is that the effective signal-to-noise ratio of the data can be significantly improved. However, this is at the expense of blurring the raw data to a lower resolution. A related step that may be applied is to filter the data in the time domain. This is done by selecting the time-course from each pixel in turn and applying a specific filter that suppresses undesirable features in the time series. Typically a band-pass filter is used that suppresses both low temporal fluctuations, that can arise from gradually evolving scanner instabilities or residual effects from subject motion, and high temporal frequencies that may be assumed to be noise (since the haemodynamic response function associated with “real” activations has a certain latency and width).
A number of final pre-statistics procedures may also be applied, such as intensity normalization of each volume (such that the total integrated intensity is the same in each volume). This is appropriate provided that the anticipated brain areas are small relative to the volume of brain covered.
8.5.2
Time-Course Modelling
Once the data have been preprocessed and are ready for final analysis a model of the expected fMRI timecourse must be generated (although one can use model-free analysis methods as an alternative). In the case of a simple block design paradigm it may be sufficient simply to model the predicted time-course

106 |
P. Jezzard and A. Toosy |
as a box car function that is “1” during periods of stimulus (or task A) and “0” during rest (or task B). An improvement to this model is to convolve the box car function with an estimate of the instantaneous haemodynamic response function (Friston et al. 1994). Such a function represents the response of the MRI signal (and hence vasculature that causes the change in MRI signal) to a brief stimulus event. This approach is used in the field of engineering when one wishes to predict the output signal from a modulating system or device when given an arbitrary input signal. This can be accomplished if one knows the output response function resulting from an instantaneous input signal, and provided one can assume that the modulating system or device acts as a linear system. This latter assumption is not always strictly true in the case of the fMRI signal, but may often be applied regardless, particularly in the case of block stimuli or widely spaced brief stimuli. Examples of the predicted fMRI time-course to a blocked and event-related experimental design are shown in Fig. 8.11a and 8.11b, respectively. Once generated, this time course model can be used as the basis for testing against each pixel time series in the raw fMRI data.
8.5.3
Statistical Inference
The ultimate aim of statistical inference is to identify those pixels whose time-course matches the modelled haemodynamic time-course, and to assign a statistical confidence to this identification, given the level of noise present. The most common approach is to adopt a general linear model (Friston et al. 1995), in which the observed data are modelled as:
y(t) = β * x(t) + c + e |
[4] |
where y(t) is the array of observed data (a 1D vector of signal intensities representing a given pixel’s timecourse); x(t) is the haemodynamic model (also sometimes known as the explanatory variable) describing the expected signal time-course resulting from the stimulus paradigm; β is the parameter estimate for x(t) (in other words it is the scalar that must be multiplied by x(t) in order to fit the data); c is a constant, and represents the signal amplitude during the baseline condition; and e is an error term, that should consist of white Gaussian-distributed random noise if the fit is good. If the paradigm consisted of two different stimuli (for example in the case of
the visual and auditory stimulus data set shown in Fig. 8.12) then a second parameter estimate and haemodynamic model can be introduced as β2 * x2(t). Note also that more sophisticated questions can be asked within this framework by generating new explanatory variables, such as whether the presence of two overlapping stimuli results in an fMRI signal that is greater than the sum of their signals if the stimuli are presented separately.
Once the entire data set has been fitted, one can produce a T statistic for each pixel location, based on the ratio between the size of the parameter estimate (β) and the size of its standard error. Once a T statistic has been calculated one can transform into a P (probability) or Z statistic image. The only remaining step is to set a threshold level at which to accept or reject pixels that pass or fail the statistical test.Typically probability thresholds of P<0.01 are selected, after suitable correction has been made for the number of statistical tests that have been performed.
8.6
Spinal Cord fMRI
Advances in the treatments of spinal cord injury and disease have improved outcome in recent years. In addition, active research is currently being undertaken to explore the possibility of promoting axonal regeneration (Horner and Gage 2000). The effective use of these treatments will require the accurate monitoring of the anatomical and functional characteristics of the spinal cord within and around the injury site. The application of fMRI to the spinal cord (spinal fMRI) as a non-invasive mapping technique of neural function is therefore potentially of great significance.
One of the earliest studies employed a unilateral hand-closing paradigm at 1.5 T to demonstrate signal change of 4.8% in the ventral grey matter of the ipsilateral seventh cervical cord segment (Yoshizawa et al. 1996). Less consistent activation was also noted in the dorsal grey horn and contralateral spinal cord, and was explained by the presence of interneuronal connections.
Subsequently, substantial human spinal fMRI work has been conducted by Stroman et al. They have concentrated on cervical cord imaging and sensory stimulation paradigms. Cervical cord BOLD-related signal changes were initially demonstrated at 3 T (Stroman et al. 1999) and then at 1.5 T (Stroman and Ryner 2001; Stroman et al. 2001b) looking at

Functional MRI |
107 |
sensory and motor-related activations. At 1.5 T GE and SE EPI were compared and found to impart similar activation signal changes (about 4–5%) although theoretically GE EPI should be expected to provide much larger signal changes than SE EPI. The authors explained this by alluding to anatomical differences between brain tissue and spinal cord. For example, only small vessels lie within the spinal cord parenchyma and these vessels tend to be radially orientated. The vessel size and orientation would maximize the magnetic field susceptibility gradients and increase the expected BOLD contrast. A further factor is that spinal cord structure,unlike the cerebral cortex, is not tortuous and is more likely to contain homogeneous grey matter and consequently be less susceptible to partial volume effects (Stroman and Ryner 2001).
Studies by Stroman et al. have also demonstrated that there may be a second contrast mechanism that manifests with SE EPI sequences at very short echo times (Stroman et al. 2001a; Stroman et al. 2002a; Stroman et al. 2003). This is because the estimated fractional signal changes during activation in SE EPI fMRI have values of about 2.5% when extrapolated to a TE of zero. This non-zero intercept has been interpreted as perhaps arising from a proton density increase within the extravascular space and has been termed “signal enhancement by extravascular protons” or SEEP. Alternatively, this effect may be related to blood volume increases.
Further work has demonstrated a dermatomal distribution of sensory stimulation (using a cold stimulus) within the cervical cord in a study of 13 healthy volunteers. By using a “clustering” technique that congregates active pixels based upon their intensity time-courses the authors were able to discriminate true activations from false ones (Stroman et al. 2002b). Lumbar spinal fMRI has also been developed in studies using temperature stimulation paradigms and has shown in healthy subjects a relationship between the magnitude of the fMRI response within the dorsal lumbar cord and the degree of noxious stimulation (Stroman et al. 2002c). In patients with spinal cord injuries, fMRI responses have also been demonstrated with lumbar sensory stimulation, even when the patients had no subjective sensations themselves. This activity tends to be localized to the contralateral side of the cord (Stroman et al. 2002c; Stroman et al. 2004).
8.7
Clinical Applications in White Matter Disorders
FMRI has many clinical and research applications. Several examples of its use in helping to understand demyelinating disease and schizophrenia are outlined below. One of its most challenging roles is to explore cortical plasticity in neurological disease.
8.7.1
Cortical Plasticity
Functional improvement is often seen following acute brain injury; however certain aspects of recovery cannot be explained by structural mechanisms such as the resolution of inflammation or oedema. FMRI has presented the opportunity to measure changes relating to interactions at the level of large neuronal populations that follow neural insult (cortical plasticity). The term cortical plasticity has been defined as the “reorganization of distributed patterns of normal task-associated brain activity that accompany action, perception, and cognition and that compensate impaired function resulting from disease or brain injury” (Frackowiak et al. 1997). Plasticity in neuroscience research may also relate to lower levels of neural organization and may include axonal/neuronal mechanisms, for example reflecting changes in sodium channel expression (Waxman 2001) or dendritic arborization (Jones and Schallert 1992), and synaptic mechanisms, for example indicating changes in synaptic density, distribution or strength (Jacobs and Donoghue 1991).
Although the capacity for cortical plasticity is at its greatest during the early years of CNS development, it appears to persist throughout life. The behavioural effects of cortical reorganization following CNS insult may be divided into different categories which describe, for example, adaptive and maladaptive processes. Adaptive cortical reorganization implies that the redistribution of neural processing in some way contributes to the mechanisms involved in clinical recovery or helps to maintain a degree of clinical function in the presence of structural damage.At least four forms of adaptive plasticity have been suggested (Grafman and Litvan 1999): (1) homologous area adaptation – implies that the damaged brain region can be compensated for by transferring the neural operations to other unaffected brain modules (usually in the homologous region of the opposite hemisphere); (2) cross-modal reassignment—occurs

108 |
P. Jezzard and A. Toosy |
when cortical modules usually devoted to processing particular sensory inputs, now accept inputs from another sensory modality; (3) map expansion—is the enlargement of a functional cortical region in response to frequent stimulus exposure or following adjacent cortical injury; and (4) compensatory masquerade – is the novel allocation of a cognitive strategy to perform a task that otherwise would depend on another cognitive process which is now impaired.
However, cortical reorganization may not necessarily contribute to recovery of clinical function. It may also reflect the recruitment of unusual distributed neural networks purely as a ‘stress’ response to CNS injury implying that it can be non-adaptive or coincidental.
Indeed, plastic changes in response to injury may also have deleterious behavioural effects resulting in functional loss rather than gain. This form of plasticity is termed maladaptive and is,for example,thought to account for phantom limb pain following amputation (Lotze et al. 2001).
8.7.2
Functional MRI in Demyelinating Disease
Several studies have been performed to investigate how the brain possibly adapts to neurological damage in demyelinating disease. These studies have mostly employed experimental paradigms for the visual and the motor systems and can be categorized into those that address (1) clinically isolated syndromes, e.g. optic neuritis, (2) relapsing remitting multiple sclerosis (MS), (3) secondary progressive MS, and (4) primary progressive MS. Further treatment of this subject can be found in Chapter 14 of this book.
8.7.3
Functional MRI in Schizophrenia
Schizophrenia is a debilitating psychiatric disorder characterized by the presence of certain types of ‘positive’ symptoms such as delusions, hallucinations and thought disorder (Andreasen 1995). These ‘positive’ symptoms are usually complemented by ‘negative’ symptoms such as psychomotor retardation and affective flattening. In addition, a significant role for cognitive dysfunction has become increasingly recognized in helping to understand the clinical deficits of schizophrenia. The cognitive deficits are related to but distinct from negative symptoms and appear to significantly influence clinical outcome in schizo-
phrenia (Sharma and Antonova 2003). FMRI has been used to investigate the neural correlates associated with both positive symptoms, negative symptoms and cognitive dysfunction over recent years. Some examples of its contributions are described below.
Auditory hallucinations constitute a prominent feature of positive symptoms and their impact has been explored in several studies. The results have suggested processing abnormalities in primary auditory and association cortices and have also implicated subcortical and limbic structures. Reduced activation in response to auditory stimulation has been found in auditory areas resulting in the concept that auditory hallucinations compete with external auditory stimuli (David et al. 1996; Woodruff et al. 1997).
A novel methodological technique was implemented by Shergill et al. to measure neural activity associated with auditory hallucinations without requiring subjects to signal when the hallucinations occurred. They discovered that auditory hallucinations are associated with activation in a distributed network of cortical and subcortical areas that include the inferior frontal/insular, anterior cingulate, and temporal cortex bilaterally (with greater responses on the right), the right thalamus and inferior colliculus, and the left hippocampus and parahippocampal cortex (Shergill et al. 2000). A further study by the same group investigated the notion of auditory hallucinations as a disorder of the self-monitoring of ‘inner speech’. Eight schizophrenic subjects with prominent auditory hallucinations were compared with eight comparison subjects using a paradigm that experimentally varied the generation rate of inner speech. When the rate was increased, the schizophrenia patients showed a relatively attenuated response within the right temporal, parietal, parahippocampal and cerebellar cortices, areas previously implicated in verbal self-monitoring (Shergill et al. 2003).
Abnormalities in the integration of auditory and visual language perception are also felt to correlate with psychotic symptoms. Surguladze et al. (2001) performed three experiments each on seven healthy volunteers and fourteen schizophrenia patients, seven of whom were actively psychotic. The tasks comprised listening to auditory speech, silent lipreading (visual speech perception) and perception of meaningless lip movements (visual non-speech). Patients overall demonstrated lower activation in temporal regions for the lip-reading task, compared with healthy controls. They also activated fewer posterior (occipitotemporal) and more anterior (frontal, insular and striatal) areas than controls, accounted

Functional MRI |
109 |
for largely by the psychotic subgroup. This suggests that schizophrenia patients with psychotic symptoms activate polysensory regions in response to visually ambiguous stimuli (non-speech) (Surguladze et al. 2001).
Investigations into cognitive dysfunction and negative symptoms can be difficult to interpret,especially with studies on working memory. This is because their interpretation can be confounded by impaired working memory function in schizophrenia patients (Sharma 2003). In spite of this, a functional abnormality of the dorsolateral prefrontal cortex (DLPFC) appears to play a significant role in complex cognitive dysfunction. Most studies have demonstrated ‘hypofrontality’ or reduced activation of the DLPFC in response to complex cognitive tasks when compared with controls (Barch et al. 2001; Barch et al. 2002; MacDonald and Carter 2003; Perlstein et al. 2001; Riehemann et al. 2001). Tasks that do not require complex processing have also demonstrated reduced DLPFC activation in schizophrenia patients relative to controls (Rubia et al. 2001).
Some studies have not observed ‘hypofrontality’. Honey et al. controlled for task performance by selecting patients with normal scores on a relatively low-load verbal memory task (Honey et al. 2002). Although no differences were found between schizophrenia patients and controls, the control group exhibited positive correlations between reaction time and the fMRI response within the posterior parietal cortex. This correlation was not found in the schizophrenia group,perhaps implying that‘hypofrontality’ occurs only when the ability of the DLPFC to respond to a working memory task is exceeded by the cognitive load.
A few other studies have reported greater DLPFC activation in schizophrenia patients with complex cognitive tasks (Callicott et al. 2000; Manoach et al. 2000; Ramsey et al. 2002). Ramsey et al., in particular, investigated the role of antipsychotic medication and controlled for cognitive performance with a logical reasoning task (Ramsey et al. 2002). Task performance was modestly reduced in the patient group. In patients on medication, the fMRI activity did not differ significantly from controls after correction for task performance. However, in medication-naive patients, the performance-corrected fMRI activity was significantly elevated within the DLPFC.These results point to increased neural recruitment with untreated schizophrenia during logical reasoning. The mixed results presented above indicate that the function(s) of the DLPFC in schizophrenia remain to be elucidated and require further research.
Knowledge about the precise neuropathological and neurophysiological substrates of schizophrenia is also incomplete. Structural findings have included enlargement of the lateral and third ventricles (Daniel et al. 1991; Lawrie and Abukmeil 1998) and reductions in grey and white matter volume and density. Grey matter abnormalities have been found within the limbic system, thalamus, medial frontal, temporal, precuneate, posterior cingulate and insular areas (Andreasen 1997;Gaser et al.1999; Hulshoff Pol et al. 2001; Wright et al. 2000).White matter abnormalities have been detected in the frontal lobes (Paillere-Martinot et al. 2001), left posterior periventricular area (Sowell et al. 2000), temporal lobes (Sigmundsson et al. 2001) and the corpus callosum (Hulshoff Pol et al. 2004).
It has been proposed that the clinical abnormalities arise from interregional aberrant connectivity or ‘disconnectivity’ (Friston 1998; Friston and Frith 1995). This hypothesis may explain the symptoms and cognitive deficits in schizophrenia and is generally felt to have some truth, but its precise nature is unknown; for example the spatial scale of the disconnectivity may be present at the synaptic or dendritic level rather than at the level of the cortical region. However, in future, by combining MR measures of function (with fMRI) and of structure (for example, with diffusion tensor imaging) it may be possible to explore the relationships between effective connectivity and anatomical connectivity in schizophrenia and thus contribute to a more complete understanding of its pathophysiology.
8.8 Conclusion
This chapter attempts to describe the principles of functional MRI, and also includes a brief discussion of applications of fMRI to white matter disorders. Conventional fMRI is only able to access haemodynamic, and hence metabolic, information from the grey matter. As such, the information that can be obtained on white matter disorders is derived from the effect that a given disorder has on the participating grey matter networks. Nevertheless, preliminary work has been done to improve our understanding of the evolution and treatment of various white matter disorders, most notably in multiple sclerosis.
One probable evolution that will occur in the field of neuroimaging is the combining of information from several different contrast mechanisms and mo-
110 |
P. Jezzard and A. Toosy |
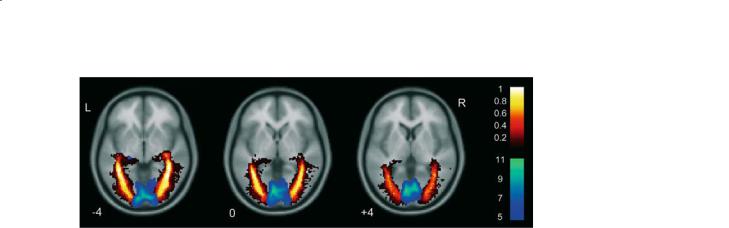
Fig. 8.13. Example of combining fMRI and DTI tractography. Group effects for functional activation and estimated optic radiations are overlaid onto a structural template. The fMRI activity was derived from a one sample t-test for 22 subjects with a visual stimulation paradigm. The winter (blue) colour scale shows the T scores. The optic radiations were estimated using DTI tractography and are displayed as spatial variability maps which demonstrate the degree of overlap (shown by the hot colour scale) between subjects for the estimated optic radiations. A value of 0.8 indicates 80% overlap between subjects. Greater intersubject overlap is noted towards the cores of the estimated optic radiations. (Reproduced from Toosy et al. 2004, with permission.)
dalities. In the context of MRI contrast it is becoming clear that diffusion-weighted information, and in particular diffusion tractography, will reveal rich information on white matter tracts, and that this information can be combined with standard fMRI contrast of the grey matter processing units. Figure 8.13 shows an example of combined fMRI and diffusion tractography imaging, indicating how structural and functional information can be combined. Beyond MRI there is the prospect of combined electroencephalography (EEG) and fMRI, in order to improve the temporal resolution of the information available. Likewise the spatial resolution of fMRI may be used to constrain the location of sources when analysing magnetoencephalography (MEG) data.
Acknowledgements
P.J. gratefully acknowledges the support of the UK Medical Research Council and the Dunhill Medical Trust. A.T. gratefully acknowledges support from the Brain Research Trust.
References
Andreasen NC (1995) Symptoms, signs, and diagnosis of schizophrenia. Lancet. 346(8973):477–481
Andreasen NC (1997) The role of the thalamus in schizophrenia. Can J Psychiatry 42(1):27–33
Bandettini PA, Wong EC, Hinks RS, Tikofsky RS, Hyde JS (1992) Time course EPI of human brain function during task activation. Magn Reson Med 25(2):390–397
Barch DM, Carter CS, Braver TS, Sabb FW, MacDonald A III, Noll DC, Cohen JD (2001) Selective deficits in prefrontal cortex function in medication-naive patients with schizophrenia. Arch Gen Psychiatry 58(3):280–288
Barch DM, Csernansky JG, Conturo T, Snyder AZ (2002) Working and long-term memory deficits in schizophrenia: is there a common prefrontal mechanism? J Abnorm Psychol 111(3):478–494
Belliveau JW, Kennedy DN Jr, McKinstry RC, Buchbinder BR, Weisskoff RM, Cohen MS, Vevea JM, Brady TJ, Rosen BR (1991) Functional mapping of the human visual cortex by magnetic resonance imaging. Science 254:716–719
Buckner RL (1998) Event-related fMRI and the hemodynamic response. Human Brain Mapping 6:373–377
Buxton RB, Frank LR (1997) A model for the coupling between cerebral blood flow and oxygen metabolism during neural stimulation. J Cereb Blood Flow Metab 17(1):64–72
Buxton RB,Wong EC, Frank LR (1998) Dynamics of blood flow and oxygenation changes during brain activation: the balloon model. Magn Reson Med 39(6):855–864
Callicott JH, Bertolino A, Mattay VS, Langheim FJ, Duyn J, Coppola R, Goldberg TE, Weinberger DR (2000) Physiological dysfunction of the dorsolateral prefrontal cortex in schizophrenia revisited. Cereb Cortex 10(11):1078–1092
Chen W, Zhu XH (1997) Suppression of physiological eye movement artifacts in functional MRI using slab presaturation. Magn Reson Med 38(4):546–550
Daniel DG, Goldberg TE, Gibbons RD, Weinberger DR (1991) Lack of a bimodal distribution of ventricular size in schizophrenia: a Gaussian mixture analysis of 1056 cases and controls. Biol Psychiatry 30(9):887–903
David AS, Woodruff PW, Howard R, Mellers JD, Brammer M, Bullmore E, Wright I, Andrew C, Williams SC (1996) Auditory hallucinations inhibit exogenous activation of auditory association cortex. Neuroreport 7(4):932–936
Davis TL, Kwong KK, Weisskoff RM, Rosen BR (1998) Calibrated functional MRI: mapping the dynamics of oxidative metabolism. Proc Natl Acad Sci U S A 95(4):1834–1839
Duyn JH, Moonen CT, van Yperen GH, de Boer RW, Luyten PR (1994) Inflow versus deoxyhemoglobin effects in BOLD functional MRI using gradient echoes at 1.5 T. NMR Biomed 7(1-2):83–88
Ernst T, Hennig J (1994) Observation of a fast response in functional MR. Magn Reson Med 32(1):146–149
Frackowiak RSJ, Friston KJ, Frith CD, Dolan RJ, Mazziotta JC

Functional MRI
(eds) (1997) Human brain function. Academic Press, San Diego
Friston KJ (1998) The disconnection hypothesis. Schizophr Res 30(2):115–125
Friston KJ, Frith CD (1995) Schizophrenia: a disconnection syndrome? Clin Neurosci 3(2):89–97
Friston KJ, Jezzard P, Turner R (1994) Analysis of functional MRI time series. Hum Brain Mapp 1:153–171
Friston K, Holmes A,Worsley K, Poline J-B, Frith C, Frackowiak R (1995) Statistical parametric maps in functional imaging: a general linear approach. Hum Brain Mapp 2:189–210
Gaser C, Volz HP, Kiebel S, Riehemann S, Sauer H (1999) Detecting structural changes in whole brain based on nonlinear deformations—application to schizophrenia research. Neuroimage 10(2):107–113
Gati JS, Menon RS, Ugurbil K, Rutt BK (1997) Experimental determination of the BOLD field strength dependence in vessels and tissue. Magn Reson Med 38(2):296–302
Golay X, Silvennoinen MJ, Zhou J, Clingman CS, Kauppinen RA, Pekar JJ, van Zijl PC (2001) Measurement of tissue oxygen extraction ratios from venous blood T2: increased precision and validation of principle. Magn Reson Med 46(2):282–291
Grafman J, Litvan I (1999) Evidence for four forms of neuroplasticity. In: Grafman J, Christen Y (eds) Neuronal plasticity: building a bridge from the laboratory to the clinic (research and perspectives in neurosciences). Springer, Berlin Heidelberg New York, pp 131–139
Grubb RL Jr, Raichle ME, Eichling JO, Ter-Pogossian MM (1974) The effects of changes in PaCO2 on cerebral blood volume, blood flow, and vascular mean transit time. Stroke 5(5):630–639
Haase A, Frahm J, Matthaei D, Hanicke W Merboldt KD (1986) FLASH imaging: rapid NMR imaging using low flip angles. J Magn Reson 67:217–222
Hennig J, Hodapp M (1993) Burst imaging. MAGMA 1:39–48 Hoge RD, Atkinson J, Gill B, Crelier GR, Marrett S, Pike GB (1999) Linear coupling between cerebral blood flow and oxygen consumption in activated human cortex. Proc Natl
Acad Sci U S A 96(16):9403–9408
Honey GD, Bullmore ET, Sharma T (2002) De-coupling of cognitive performance and cerebral functional response during working memory in schizophrenia. Schizophr Res 53(1-2):45–56
Horner PJ, Gage FH (2000) Regenerating the damaged central nervous system. Nature 407(6807):963–970
Hulshoff Pol HE, Schnack HG, Mandl RC, van Haren NE, Koning H, Collins DL, Evans AC, Kahn RS (2001) Focal gray matter density changes in schizophrenia. Arch Gen Psychiatry 58(12):1118–1125
Hulshoff Pol HE, Schnack HG, Mandl RC, Cahn W, Collins DL, Evans AC, Kahn RS (2004) Focal white matter density changes in schizophrenia: reduced inter-hemispheric connectivity. Neuroimage 21(1):27–35
Jacobs KM, Donoghue JP (1991) Reshaping the cortical motor map by unmasking latent intracortical connections. Science 251(4996):944–947
Jakob PM, Schlaug G, Griswold M, Lovblad KO, Thomas R, Ives JR, Matheson JK, Edelman RR (1998) Functional BURST imaging. Magn Reson Med 40(4):614–621
Jezzard P, Balaban RS (1995) Correction for geometric distortion in echo planar images from B0 field variations. Magn Reson Med 34:65–73
111
Jezzard P, Matthews PM, Smith SM (Eds) (2001) Functional magnetic resonance imaging: an introductory guide. Oxford University Press, Oxford
Jones TA, Schallert T (1992) Overgrowth and pruning of dendrites in adult rats recovering from neocortical damage. Brain Res 581(1):156–160
Kim SG, Tsekos NV, Ashe J (1997) Multi-slice perfusion-based functional MRI using the FAIR technique: comparison of CBF and BOLD effects. NMR Biomed 10(4-5):191–196
Kruger G, Glover GH (2001) Physiological noise in oxygena- tion-sensitive magnetic resonance imaging. Magn Reson Med 46(4):631–637
Kwong KK, Belliveau JW, Chesler DA, Goldberg IE, Weisskoff RM, Poncelet BP, Kennedy DN, Hoppel BE, Cohen MS, Turner R, et al (1992) Dynamic magnetic resonance imaging of human brain activity during primary sensory stimulation. Proc Natl Acad Sci U S A 89(12):5675–5679
Lawrie SM, Abukmeil SS (1998) Brain abnormality in schizophrenia: a systematic and quantitative review of volumetric magnetic resonance imaging studies. Br J Psychiatry 172:110–120
Liu G, Sobering G, Duyn J, Moonen CTW (1993) A functional MRI technique combining principles of echo-shifting with a train of observations (PRESTO). Magn Reson Med 30:764–768
Logothetis NK, Pauls J, Augath M, Trinath T, Oeltermann A (2001) Neurophysiological investigation of the basis of the fMRI signal. Nature 412(6843):150–157
Lotze M, Flor H, Grodd W, Larbig W, Birbaumer N (2001) Phantom movements and pain: an fMRI study in upper limb amputees. Brain 124(11):2268–2277
Lowe IJ,Wysong RE (1993) DANTE ultrafast imaging sequence (DUFIS). J Magn Reson 101:106–109
Luh WM, Wong EC, Bandettini PA, Ward BD, Hyde JS (2000) Comparison of simultaneously measured perfusion and BOLD signal increases during brain activation with T(1)- based tissue identification. Magn Reson Med 44(1):137– 143
MacDonald AW III, Carter CS (2003) Event-related FMRI study of context processing in dorsolateral prefrontal cortex of patients with schizophrenia. J Abnorm Psychol 112(4):689–697
Mandeville JB, Marota JJ, Kosofsky BE, Keltner JR, Weissleder R, Rosen BR, Weisskoff RM (1998) Dynamic functional imaging of relative cerebral blood volume during rat forepaw stimulation. Magn Reson Med 39(4):615–624
Mandeville JB, Marota JJ, Ayata C, Zaharchuk G, Moskowitz MA, Rosen BR, Weisskoff RM (1999) Evidence of a cerebrovascular postarteriole windkessel with delayed compliance. J Cereb Blood Flow Metab 19(6):679–689
Manoach DS, Gollub RL, Benson ES, Searl MM, Goff DC, Halpern E, Saper CB, Rauch SL (2000) Schizophrenic subjects show aberrant fMRI activation of dorsolateral prefrontal cortex and basal ganglia during working memory performance. Biol Psychiatry 48(2):99–109
Mansfield P (1977) Multi-planar image formation using NMR spin echoes. J Phys C 10:L55–L58
McKinnon GC (1993) Ultrafast interleaved gradient-echo- planar imaging on a standard scanner. Magn Reson Med 30(5):609–616
Menon RS, Ogawa S, Hu X, Strupp JP, Anderson P, Ugurbil K (1995) BOLD based functional MRI at 4 Tesla includes a capillary bed contribution: echo-planar imaging correlates

112
with previous optical imaging using intrinsic signals. Magn Reson Med 33(3):453–459
Meyer CH, Macovski A (1987) Square spiral fast imaging: interleaving and off-resonance effects. Proceedings 6th Society for Magnetic Resonance in Medicine 1:230
Moonen CT, Liu G, van Gelderen P, Sobering G (1992) A fast gradient-recalled MRI technique with increased sensitivity to dynamic susceptibility effects. Magn Reson Med 26(1):184–189
Ogawa S, Lee TM, Nayak AS, Glynn P (1990) Oxygenation-sen- sitive contrast in magnetic resonance image of rodent brain at high magnetic fields. Magn Reson Med 14(1):68–78
Ogawa S, Tank DW, Menon R, Ellermann JM, Kim SG, Merkle H, Ugurbil K (1992) Intrinsic signal changes accompanying sensory stimulation: functional brain mapping with magnetic resonance imaging. Proc Natl Acad Sci U S A 89(13):5951–5955
Ogawa S, Menon RS, Tank DW, Kim SG, Merkle H, Ellermann JM, Ugurbil K (1993) Functional brain mapping by blood oxygenation level-dependent contrast magnetic resonance imaging. A comparison of signal characteristics with a biophysical model. Biophys J 64(3):803–812
Oja JM, Gillen JS, Kauppinen RA, Kraut M, van Zijl PC (1999) Determination of oxygen extraction ratios by magnetic resonance imaging. J Cereb Blood Flow Metab 19(12):1289– 1295
Ostergaard L, Weisskoff RM, Chesler DA, Gyldensted C, Rosen BR (1996) High resolution measurement of cerebral blood flow using intravascular tracer bolus passages. Part I: Mathematical approach and statistical analysis. Magn Reson Med 36(5):715–725
Paillere-Martinot M, Caclin A, Artiges E, Poline JB, Joliot M, Mallet L, Recasens C, Attar-Levy D, Martinot JL (2001) Cerebral gray and white matter reductions and clinical correlates in patients with early onset schizophrenia. Schizophr Res 50(1-2):19–26
Pauling L, Coryell C (1936) The magnetic properties and structure of hemoglobin, oxyhemoglobin and carbon monoxyhemoglobin. Proc Natl Acad Sci U S A 22:210–216
Perlstein WM, Carter CS, Noll DC, Cohen JD (2001) Relation of prefrontal cortex dysfunction to working memory and symptoms in schizophrenia. Am J Psychiatry 158(7):1105–1113
Ramsey NF, Koning HA, Welles P, Cahn W, van der Linden JA, Kahn RS (2002) Excessive recruitment of neural systems subserving logical reasoning in schizophrenia. Brain 125(8):1793–1807
Riehemann S, Volz HP, Stutzer P, Smesny S, Gaser C, Sauer H (2001) Hypofrontality in neuroleptic-naive schizophrenic patients during the Wisconsin Card Sorting Test—a fMRI study. Eur Arch Psychiatry Clin Neurosci 251(2):66–71
Rosen BR, Belliveau JW, Aronen HJ, Kennedy D, Buchbinder BR, Fischman A, Gruber M, Glas J, Weisskoff RM, Cohen MS, et al (1991) Susceptibility contrast imaging of cerebral blood volume: human experience. Magn Reson Med 22(2):293–299
Rubia K, Russell T, Bullmore ET, Soni W, Brammer MJ, Simmons A, Taylor E, Andrew C, Giampietro V, Sharma T (2001) An fMRI study of reduced left prefrontal activation in schizophrenia during normal inhibitory function. Schizophr Res 52(1-2):47–55
Sharma T (2003) Insights and treatment options for psychiatric disorders guided by functional MRI. J Clin Invest 112(1):10–18
P. Jezzard and A. Toosy
Sharma T, Antonova L (2003) Cognitive function in schizophrenia. Deficits, functional consequences, and future treatment. Psychiatr Clin North Am 26(1):25–40
Shergill SS, Brammer MJ, Williams SC, Murray RM, McGuire PK (2000) Mapping auditory hallucinations in schizophrenia using functional magnetic resonance imaging. Arch Gen Psychiatry 57(11):1033–1038
Shergill SS, Brammer MJ, Fukuda R, Williams SC, Murray RM, McGuire PK (2003) Engagement of brain areas implicated in processing inner speech in people with auditory hallucinations. Br J Psychiatry 182:525–531
Sigmundsson T, Suckling J, Maier M, Williams S, Bullmore E, Greenwood K, Fukuda R, Ron M, Toone B (2001) Structural abnormalities in frontal, temporal, and limbic regions and interconnecting white matter tracts in schizophrenic patients with prominent negative symptoms.Am J Psychiatry 158(2):234–243
Sowell ER, Levitt J, Thompson PM, Holmes CJ, Blanton RE, Kornsand DS, Caplan R, McCracken J, Asarnow R, Toga AW (2000) Brain abnormalities in early-onset schizophrenia spectrum disorder observed with statistical parametric mapping of structural magnetic resonance images. Am J Psychiatry 157(9):1475–1484
Springer CS (1994) Bulk magnetic susceptibility frequency shifts in cell suspensions. NMR Biomed 7:198–202
Stroman PW, Ryner LN (2001) Functional MRI of motor and sensory activation in the human spinal cord. Magn Reson Imaging 19(1):27–32
Stroman PW, Nance PW, Ryner LN (1999) BOLD MRI of the human cervical spinal cord at 3 Tesla. Magn Reson Med 42(3):571–576
Stroman PW, Krause V, Frankenstein UN, Malisza KL, Tomanek B (2001a) Spin-echo versus gradient-echo fMRI with short echo times. Magn Reson Imaging 19(6):827–831
Stroman PW, Krause V, Malisza KL, Frankenstein UN, Tomanek B (2001b) Characterization of contrast changes in functional MRI of the human spinal cord at 1.5 T. Magn Reson Imaging 19(6):833–838
Stroman PW, Krause V, Malisza KL, Frankenstein UN, Tomanek B (2002a) Extravascular proton-density changes as a nonBOLD component of contrast in fMRI of the human spinal cord. Magn Reson Med 48(1):122–127
Stroman PW, Krause V, Malisza KL, Frankenstein UN, Tomanek B (2002b) Functional magnetic resonance imaging of the human cervical spinal cord with stimulation of different sensory dermatomes. Magn Reson Imaging 20(1):1–6
Stroman PW, Tomanek B, Krause V, Frankenstein UN, Malisza KL (2002c) Mapping of neuronal function in the healthy and injured human spinal cord with spinal fMRI. Neuroimage 17(4):1854–1860
Stroman PW, Tomanek B, Krause V, Frankenstein UN, Malisza KL (2003) Functional magnetic resonance imaging of the human brain based on signal enhancement by extravascular protons (SEEP fMRI). Magn Reson Med 49(3):433–439 Stroman PW, Kornelsen J, Bergman A, Krause V, Ethans K, Malisza KL, Tomanek B (2004) Noninvasive assessment of the injured human spinal cord by means of functional mag-
netic resonance imaging. Spinal Cord 42(2):59–66 Surguladze SA, Calvert GA, Brammer MJ, Campbell R, Bull-
more ET, Giampietro V, David AS (2001) Audio-visual speech perception in schizophrenia: an fMRI study. Psychiatry Res 106(1):1–14
Thulborn KR, Gisbert A (2001) Clinical applications of map-

Functional MRI
ping neurocognitive processes in the human brain with functional MRI. In: Jezzard P, Matthews PM, Smith SM (eds) Functional magnetic resonance imaging: an introductory guide. Oxford University Press, Oxford, pp 353–382
Thulborn KR, Waterton JC, Matthews PM, Radda GK (1982) Oxygenation dependence of the transverse relaxation time of water protons in whole blood at high field. Biochim Biophys Acta 714(2):265–270
Toosy AT, Ciccarelli O, Parker GJ, Wheeler-Kingshott CA, Miller DH, Thompson AJ (2004) Characterising functionstructure relationships in the human visual system with functional MRI and diffusion tensor imaging. Neuroimage 21(4):1452–1463
Turner R (2002) How much cortex can a vein drain? Downstream dilution of activation-related cerebral blood oxygenation changes. Neuroimage 16(4):1062–1067
Turner R, Le Bihan D, Moonen CT, Despres D, Frank J (1991) Echo-planar time course MRI of cat brain oxygenation changes. Magn Reson Med 22(1):159–166
van Zijl PCM, Eleff SM, Ulatowski JA, Oja JME, Ulug AM, TraystmanRJ,KauppinenRA(1998)Quantitativeassessmentof blood flow,blood volume and blood oxygenation effects in functional magnetic resonance imaging. Nat Med 4(2):159–167
Waxman SG (2001) Acquired channelopathies in nerve injury and MS. Neurology 56(12):1621–1627
Weisskoff RM (1996) Simple measurement of scanner stabil-
113
ity for functional NMR imaging of activation in the brain. Magn Reson Med 36:643–645
Williams DS, Detre JA, Leigh JS, Koretsky AP (1992) Magnetic resonance imaging of perfusion using spin inversion of arterial water. Proc Natl Acad Sci U S A 89(1):212–216
Wong EC, Buxton RB, Frank LR (1998) Quantitative imaging of perfusion using a single subtraction (QUIPSS and QUIPSS II). Magn Reson Med 39:702–708
Wong EC, Buxton RB, Frank LR (1999) Quantitative perfusion imaging using arterial spin labeling. Neuroimaging Clin N Am 9(2):333–342
Woodruff PW, Wright IC, Bullmore ET, Brammer M, Howard RJ, Williams SC, Shapleske J, Rossell S, David AS, McGuire PK, Murray RM (1997) Auditory hallucinations and the temporal cortical response to speech in schizophrenia: a functional magnetic resonance imaging study. Am J Psychiatry 154(12):1676–1682
Wright IC, Rabe-Hesketh S, Woodruff PW, David AS, Murray RM, Bullmore ET (2000) Meta-analysis of regional brain volumes in schizophrenia. Am J Psychiatry 157(1):16–25
Ye FQ,Allen PS (1995) Relaxation enhancement of the transverse magnetization of water protons in paramagnetic suspensions of red blood cells. Magn Reson Med 34(5):713–720
Yoshizawa T, Nose T, Moore GJ, Sillerud LO (1996) Functional magnetic resonance imaging of motor activation in the human cervical spinal cord. Neuroimage 4(3):174–182