

01 POWER ISLAND / 02 H2+NH3 / IEA 2022 NetZeroby2050-ARoadmapfortheGlobalEnergySector
.pdfThe path to net zero emissions could be facilitated by early government action to help move several technologies that provide power system flexibility through the demonstration phases and bring them to market. Expanding the set of energy storage technologies to complement batteries and addressing emerging needs for longer duration seasonal storage would be of particular value. Technical solutions to support the stability of power grids with high shares of solar and wind would also benefit from research and development (R&D) support.
There are three important sets of decisions to be made concerning nuclear power: lifetime extensions; pace of new construction; and advances in nuclear power technology. In advanced economies, decisions need to be made about new construction and the large number of nuclear power plants that may be retired over the next decade absent action to extend their lifetimes and make the required investment. Without further lifetime extensions and new projects beyond those already under construction, nuclear power output in advanced economies will decline by two thirds over the next two decades (IEA, 2019). In emerging market and developing economies, there are decisions to be made about the pace of new nuclear power construction. From 2011 to 2020, an average of 6 GW of new nuclear capacity came online each year. By 2030, the rate of new construction increases to 24 GW per year in the NZE. The third set of decisions concerns the extent of government support for advanced nuclear technologies, particularly those related to small modular reactors and high temperature gas reactors, both of which can expand markets for nuclear power beyond electricity.
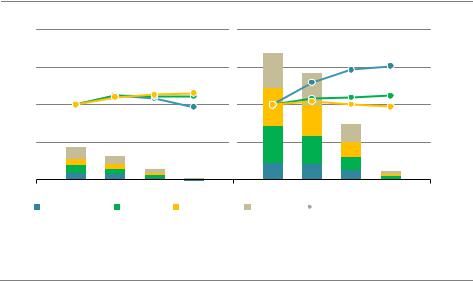
Figure 3.14 Additional global alternative capacity needed in a Low Nuclear and CCUS Case
GW
3 000 |
|
|
|
|
|
|
|
|
Other dispatchable |
|
|
|
|
|
|
|
|
||
|
|
|
|
|
|
|
|
||
|
|
|
|
|
|
|
|
|
Batteries |
|
|
|
|
|
|
|
|
|
|
|
|
|
|
|
|
|
|
|
|
2 000 |
|
|
|
|
|
|
|
|
Solar PV |
|
|
|
|
|
|
|
|
||
|
|
|
|
|
|
|
|
||
|
|
|
|
|
|
|
|
Wind |
|
|
|
|
|
|
|
|
|
|
|
|
|
|
|
|
|
|
|
|
|
|
|
|
|
|
|
|
|
|
CCUS |
|
|
|
|
|
|
|
|
|
|
|
|
|
|
|
|
|
|
|
|
1 000 |
|
|
|
|
|
|
|
|
Nuclear |
|
|
|
|
|
|
|
|
||
|
|
|
|
|
|
|
|
||
0 |
|
|
|
|
|
|
|
|
|
|
|
|
|
|
|
|
|
|
|
1 000 |
2030 |
2035 |
2040 |
2045 |
2050 |
|
|
|
|
2025 |
|
|
|
||||||
IEA. All rights reserved.
Sharply reducing the roles of nuclear power and carbon capture would require even faster growth in solar PV and wind, making achieving the net zero goal more costly and less likely
Note: The Low Nuclear and CCUS Case assumes that global nuclear power output is about 60% lower in 2050 than in the NZE due to no additional lifetime extensions or new nuclear projects in advanced economies and no expansion of the current pace of construction in emerging market and developing economies, and that the amount of coal and gas fired capacity equipped with CCUS is 99% lower than in the NZE.
120 |
International Energy Agency | Special Report |

Failing to take timely decisions on nuclear power and CCUS would raise the costs of a net |
|
|
zero emissions pathway and add to the risk of not meeting the goal by placing an additional |
|
|
burden on wind and solar to scale up even more quickly than in the NZE (Figure 3.14). In a |
|
|
Low Nuclear and CCUS Case, we assume that global nuclear power output is 60% lower in |
|
|
2050 than in the NZE as a result of no additional nuclear lifetime extensions or new projects |
|
|
in advanced economies and no expansion of the current pace of construction in emerging |
|
|
market and developing economies, and that only the announced CCUS projects are |
|
|
completed (representing 1% of the CCUS capacity added in the NZE). |
3 |
|
Our analysis indicates that the burden of replacing those sources of low carbon generation |
||
|
||
would fall mainly on solar PV and wind power, calling for 2 400 GW more capacity than in |
|
|
the NZE – an amount far exceeding their combined global capacity in operation in 2020 |
|
|
(Figure 3.14). There would also be a need for about 480 GW of battery capacity above and |
|
|
beyond the 3 100 GW deployed in the NZE, plus more than 300 GW of other dispatchable |
|
|
capacity to meet demand in all seasons and ensure system adequacy. This would call for an |
|
|
additional USD 2 trillion investment in power plants and related grid assets (net of lower |
|
|
investment in nuclear and CCUS). Taking account of avoided fuel costs, the estimated total |
|
|
additional cost of electricity to consumers between 2021 and 2050 is USD 260 billion. |
|
3.5Industry
3.5.1Energy and emission trends in the Net Zero Emissions Scenario
As the second largest global source of energy sector CO2 emissions, industry has a vital contribution to make in achieving the net zero goal. Industrial CO2 emissions6 (including from energy use and production processes) totalled about 8.4 Gt in 2020. Advanced economies accounted for around 20% and emerging market and developing economies for around 80%, although complex global supply chains for the production of materials and manufacturing mean that advanced economies generally consume far more finished goods than they produce.
Three heavy industries – chemicals, steel and cement – account for nearly 60% of all industrial energy consumption and around 70% of CO2 emissions from the industry sector. Production is highly concentrated in emerging market and developing economies, which account for 70 90% of the combined output of these commodities (Figure 3.15). China alone was responsible for almost 60% of both steel and cement production in 2020. These bulk materials are essential inputs to our modern way of life, with few cost competitive substitutes; the challenge is to carry on producing these materials without emitting CO2.
The outlook for global materials demand in the NZE is one of plateaus and small increases. This is in stark contrast with the growth seen during the last two decades when global steel
6 All CO2 emissions in this section refer to direct CO2 emissions from the industry sector unless otherwise specified.
Chapter 3 | Sectoral pathways to net-zero emissions by 2050 |
121 |
IEA. All rights reserved.
demand rose by 2.1 times, cement by 2.4 times and plastics (a key group of material outputs from the chemical sector) by 1.9 times in response to global economic and population expansion. When economies are developing, per capita material demand tends to rise rapidly to build up stocks of goods and infrastructure. As economies mature, future demand stems primarily from the need to refurbish and replace these stocks, the levels of which tend to saturate. In the NZE, flattening or even declining demand in many countries around the world leads to slower global demand growth. Some countries such as India see higher growth in steel and cement production, while production in China declines considerably following its industrial boom period after the turn of the millennium.
Figure 3.15 Global CO2 emissions from industry by sub-sector in the NZE
Gt CO2
8
6
4
2
Advancedeconomies |
Emergingmarketand developingeconomies |
200 |
= 100) |
|
|
150 |
(2020Index |
|
|
100 |
|
50 |
|
2020 |
2030 |
2040 |
2050 |
2020 |
2030 |
2040 |
2050 |
Chemicals |
Steel |
|
Cement |
Other |
Material production (right axis) |
||
IEA. All rights reserved.
The majority of residual emissions in industry in 2050 come
from heavy industries in emerging market and developing economies
Note: Other includes the production of aluminium, paper, other non metallic minerals and other non ferrous metals, and a series of light industries.
Certain segments of material demand increase rapidly to support the required expansion of energy related infrastructure in the NZE, notably renewable electricity generation and transport infrastructure. The additional infrastructure required for these two segments by 2050 relative to today alone contributes roughly 10% of steel demand in 2050. But co ordinated cross sectoral strategies, including modal shifts in transport and building renovation, as well as other changes in design, manufacturing methods, construction practices and consumer behaviour, more than offset this increase. Overall, global demand for steel in 2050 is 12% higher than today, primary chemicals is 30% higher and cement demand is broadly flat.
CO2 emissions from heavy industry decline by 20% by 2030 and 93% by 2050 in the NZE. Optimising the operational efficiency of equipment, adopting the best available technologies for new capacity additions and measures to improve material efficiency play an important
122 |
International Energy Agency | Special Report |
part in this. However, there are limits to how much emissions can be reduced by these measures. Almost 60% of emissions reductions in 2050 in the NZE are achieved using technologies that are under development today (large prototype or demonstration scale) (Figure 3.16).
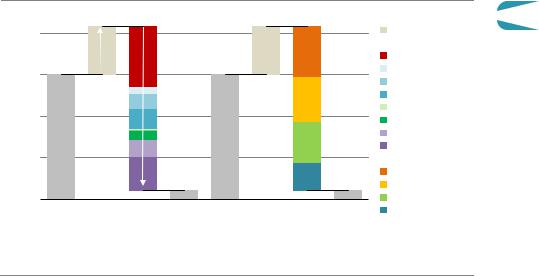
Figure 3.16 Global CO2 emissions in heavy industry and reductions by mitigation measure and technology maturity category in the NZE
Mitigationmeasures |
Maturityof measures |
2 |
8 |
|
|
|
Activity |
CO |
+39% |
|
|
|
Measure |
|
|
|
CCUS |
||
Gt |
|
|
|
|
|
|
|
|
|
Energy efficiency |
|
|
6 |
|
|
|
|
|
|
|
|
Other fuel shifts |
|
|
|
|
|
|
|
|
|
95% |
|
|
Electrification |
|
4 |
|
|
Other renewables |
|
|
|
|
|
Bioenergy |
|
|
|
|
|
|
Hydrogen |
|
2 |
|
|
|
Material efficiency |
|
|
|
|
Maturity |
|
|
|
|
|
|
Prototype |
|
|
|
|
|
Demonstration |
|
2020 |
2050 |
2020 |
2050 |
Market uptake |
|
Mature |
||||
|
|
|
|
|
IEA. All rights reserved. |
An array of measures reduces emissions in heavy industry,
with innovative technologies like CCUS and hydrogen playing a critical role
Hydrogen and CCUS technologies together contribute around 50% of the emissions reductions in heavy industry in 2050 in the NZE. These technologies enable the provision of large amounts of high temperature heat, which in many cases cannot be easily provided by electricity with current technologies, and help to reduce process emissions from the chemical reactions inherent in some industrial production. Bioenergy also makes a contribution in a wide array of industrial applications.
Aside from the need for high temperature heat and process emissions, two factors explain the slower pace of emissions reductions in heavy industries relative to other areas of the energy system. First, the ease with which many industrial materials and products can be traded globally means that markets are competitive and margins are low. This leaves little room to absorb additional costs stemming from the adoption of more expensive production pathways. It will take time to develop robust global co operation and technology transfer frameworks or domestic solutions to enable a level playing field for these technologies. Second, heavy industries use capital intensive and long lived equipment, which slows the deployment of innovative low emission technologies. Capacity additions in the period to 2030 – before a large scale roll out of innovative processes can take place – largely explain the persistence of industrial emissions in 2050, more than 80% of which are in emerging market and developing economies. Strategically timed investment in low carbon technologies could help minimise early retirements (Box 3.1).
Chapter 3 | Sectoral pathways to net-zero emissions by 2050 |
123 |
3
IEA. All rights reserved.
Box 3.1 Investment cycles in heavy industry
For heavy industry, the year 2050 is just one investment cycle away. Average lifetimes of emissions intensive assets such as blast furnaces and cement kilns are around 40 years. After about 25 years of operation, however, plants often undergo a major refurbishment to extend their lifetimes.
The challenge is to ensure that innovative near zero emissions industrial technologies that are at large prototype and demonstration stage today reach markets within the next decade, when around 30% of existing assets will have reached 25 years of age and thus face an investment decision. If these innovative technologies are not ready, or not used even if ready, this would have a major negative impact on the pace of emissions reductions or risk an increase in stranded assets (Figure 3.17). Conversely, if they are ready, and if existing plants are retrofit or replaced with them at the 25 year investment decision point, this could reduce projected cumulative emissions to 2050 from existing heavy industry assets by around 40%. The critical window of opportunity from now to 2030 should not be missed.
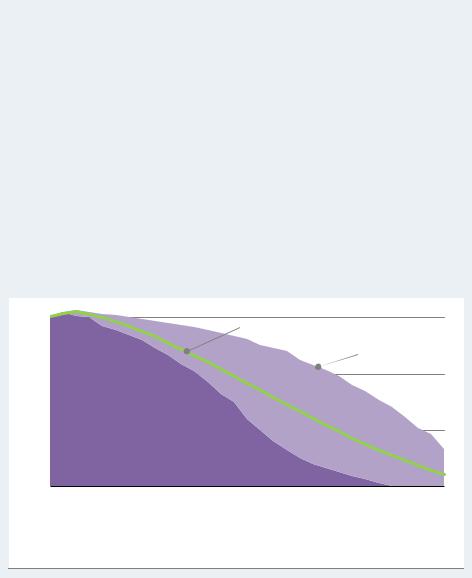
Figure 3.17 CO2 emissions from existing heavy industrial assets in the NZE
Gt CO2
6
NZE (heavy industry)
Existing infrastructure:
Typical lifetime
4
2Existing infrastructure: 25 year
investment cycle
2020 |
2030 |
2040 |
2050 |
|
|
|
IEA. All rights reserved. |
Intervening at the end of the next 25-year investment cycle could help unlock 60 Gt CO2, around 40% of projected emissions from existing heavy industry assets
The energy mix in industry changes radically in the NZE. The share of fossil fuels in total energy use declines from around 70% today to 30% in 2050. The vast majority of fossil fuels still being used then are in heavy industries, mainly as chemical feedstock (50%) or in plants equipped with CCUS (around 30%). Electricity is the dominant fuel in industrial energy demand growth, with its share of total industrial energy consumption rising from 20% in 2020 to 45% in 2050. Some 15% of this electricity is used to produce hydrogen. Bioenergy plays an important role, contributing 15% of total energy use in 2050, but sustainable supplies are
124 |
International Energy Agency | Special Report |
limited, and it is also in high demand in the power and transport sectors. Renewable solar and geothermal technologies to provide heat make a small but fast growing contribution (Figure 3.18).
Figure 3.18 Global final industrial energy demand by fuel in the NZE
100% |
|
|
Totalindustry |
|
|
|
|
|
Heavyindustry |
|
|
|||||
|
|
|
|
|
|
|
|
|
|
|
|
|
|
|
||
80% |
|
|
|
|
|
|
|
|
|
|
|
|
|
3 |
||
60% |
|
|
|
|
|
|
|
|
|
|
|
|
|
|
|
|
40% |
|
|
|
|
|
|
|
|
|
|
|
|
|
|
|
|
20% |
|
|
|
|
|
|
|
|
|
|
|
|
|
|
|
|
|
|
|
|
|
|
|
|
|
|
|
|
|
|
|
|
|
2020 |
2030 |
2040 |
2050 |
2020 |
2030 |
2040 |
2050 |
|||||||||
|
|
Coal |
|
|
Coal with CCUS |
|
|
|
Oil |
|
|
Natural gas |
|
|
||
|
|
|
|
|
|
|
|
|
|
|
||||||
|
|
Natural gas with CCUS |
|
Electricity |
|
|
|
Electricity for hydrogen |
|
Heat (imported) |
|
|
||||
|
|
|
|
|
|
|
|
|
||||||||
|
|
Bioenergy and waste |
|
Other renewables |
|
|
|
Hydrogen (imported) |
|
|
|
|
||||
|
|
|
|
|
|
|
|
|
|
|||||||
|
|
|
|
|
|
|
|
|
|
|||||||
IEA. All rights reserved.
Fossil fuel use in industry is halved by 2050, replaced primarily by electricity and bioenergy
Notes: Industrial energy consumption includes chemical feedstock and energy consumed in blast furnaces and coke ovens. Hydrogen refers to imported hydrogen and excludes captive hydrogen generation. Electricity for hydrogen refers to electricity used in the production of captive hydrogen via electrolysis.
Chemicals production
In the NZE, emissions from the chemicals sub sector fall from 1.3 Gt in 2020 to 1.2 Gt in 2030 and around 65 Mt in 2050. The share of fossil fuels in total energy use falls from 83% in 2020 (mostly oil and natural gas), to 76% in 2030 and 61% in 2050. Oil remains the largest fuel used in primary chemicals production by 2050 in the NZE, along with smaller quantities of gas and coal.
Technologies that are currently available on the market account for almost 80% of the emissions savings achieved globally in the chemical industry by 2030 in the NZE relative to today. They include recycling and re use of plastics and more efficient use of nitrogen fertilisers, which reduce the demand for primary chemicals, and measures to increase energy efficiency. Beyond 2030, the bulk of emissions reductions result from the use of technologies whose integration in chemical processes is under development today, including certain CCUS applications and electrolytic hydrogen generated directly from variable renewable electricity (Figure 3.19). CCUS equipped conventional routes and pyrolysis technologies are most competitive in regions with access to low cost natural gas, while electrolysis is the favoured option in regions where the deployment of CCUS is impeded by a lack of infrastructure or public acceptance.
Chapter 3 | Sectoral pathways to net-zero emissions by 2050 |
125 |
IEA. All rights reserved.
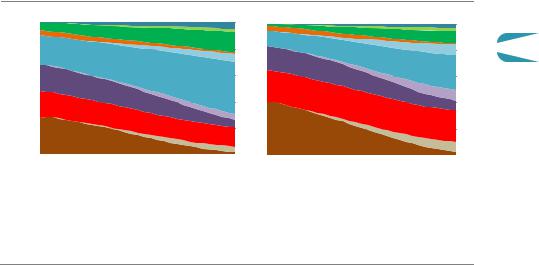
Figure 3.19 Global industrial production of bulk materials by production route in the NZE
Chemicals |
Steel |
Cement |
||
100% |
|
|
|
Conventional routes |
|
|
|
|
|
|
|
|
|
|
Innovativeroutes
75%  Other
Other
 Hydrogen based
 CCUS equipped
50%
25%
2020 2030 2050 |
2020 2030 2050 |
2020 2030 2050 |
IEA. All rights reserved.
Near-zero emissions routes dominate cement, primary steel and chemicals production by 2050, with key roles for CCUS and hydrogen-based technologies
Notes: CCUS = carbon capture, utilisation and storage. Chemicals refers to the production of primary chemicals (ethylene, propylene, benzene, toluene, mixed xylenes, ammonia and methanol). Steel refers to primary steel production. Other includes innovative processes that utilise bioenergy and directly electrify production. Hydrogen based refers to electrolytic hydrogen. Fossil fuel based hydrogen with CCUS is included in the CCUS equipped category.
Iron and steel production
In the NZE, global CO2 emissions from the iron and steel sub sector fall from 2.4 Gt in 2020 to 1.8 Gt in 2030 and 0.2 Gt in 2050, as the unabated use of fossil fuels falls sharply. Their share of the overall fuel mix drops from 85% today to just over 30% in 2050. The steel industry remains one of the last sectors using significant amounts of coal in 2050, primarily due to its importance as a chemical reduction agent, albeit mostly in conjunction with CCUS.
The NZE sees a radical technological transformation of the iron and steel sub sector based largely on a major shift from coal to electricity. By 2050, electricity and other non fossil fuels account for nearly 70% of final energy demand in the sector, up from just 15% in 2020. This shift is driven by technologies such as scrap based electric arc furnaces (EAF), hydrogen based direct reduced iron (DRI) facilities, iron ore electrolysis and the electrification of ancillary equipment. The share of coal in total energy use drops from 75% in 2020 to 22% by 2050 in the NZE, of which 90% is used in conjunction with CCUS.
Technologies that are currently on the market deliver around 85% of emissions savings in steel production to 2030. They include material and energy efficiency measures and a major increase in scrap based production – which requires only around one tenth of the energy of primary steel production – driven primarily by increased scrap availability as more products reach their end of life. Partial hydrogen injection into commercial blast furnaces and DRI
126 |
International Energy Agency | Special Report |

furnaces gain pace in the mid 2020s, building on pilot projects testing the practice today. After 2030, the bulk of emission reductions come from the use of technologies that are under development, including hydrogen based DRI and iron ore electrolysis. Several CCUS equipped process technologies are deployed in parallel, including innovative smelting reduction, natural gas based DRI production (particularly in regions with low natural gas prices) and innovative blast furnace retrofit arrangements in regions with relatively young plants.
Cement production |
3 |
Producing a tonne of cement today generates around 0.6 tonnes CO2 on average, two thirds of which are process emissions generated from carbon released from the raw materials used. Fossil fuels – mostly coal plus some petroleum coke – account for 90% of thermal energy needs.
Increased blending of alternative materials into cement to replace a portion of clinker (the active and most emissions intensive ingredient), lower demand for cement and energy efficiency measures deliver around 40% of the emissions savings in 2030 compared with 2020. Through use of blended cements, the global clinker to cement ratio declines from 0.71 in 2020 to 0.65 in 2030. The ratio continues to decline after 2030, but more slowly, reaching 0.57 in 2050 (blended cements could reach a clinker to cement ratio as low as 0.5, but market application potential depends on regional contexts). Limestone and calcined clay are the main alternative materials used in blended cements by 2050. Since 0.5 is the lowest technically achievable clinker to cement ratio, other measures are needed to achieve deeper emission reductions.
After 2030 in the NZE, the bulk of emissions reductions come from the use of technologies that are under development today. CCUS is the most important, accounting for 55% of reductions in 2050 relative to today. In many cases, it is more cost effective in the NZE to apply CCUS to fossil fuel combustion emissions than to switch to zero emissions energy sources. Coal use is eliminated from cement production by 2050, when natural gas accounts for about 40% of thermal energy (up from 15% today), biomass and renewable waste for a further 35% (up from less than 5% today), hydrogen and direct electrification for just about 15%, and oil products and non renewable waste for the remainder. Constraints on the availability of sustainable biomass supplies prevent it from claiming a higher share. Direct electrification of cement kilns is at the small prototype stage today, and so only starts to be deployed after 2040 on a small scale. From the 2040s, hydrogen provides around 10% of thermal energy needs in cement kilns, although blending of small amounts begins earlier. Innovative types of cement based on alternative binding materials that limit or avoid the generation of process emissions, and even enable CO2 capture during the curing process, are either still at much earlier stages of development relative to other options like CCUS, or have limited applicability.
Chapter 3 | Sectoral pathways to net-zero emissions by 2050
127 |
IEA. All rights reserved. |
Box 3.2 What about other industry sub-sectors?
Steel, cement and chemicals are not the only outputs from the industry sector. It also includes other energy intensive sub sectors such as aluminium, paper, other non metallic minerals and non ferrous metals, as well as light industries that produce vehicles, machinery, food, timber, textiles and other consumer goods, together with the energy consumed in construction and mining operations.
Emissions from the light industries decline by around 30% by 2030 and around 95% by 2050 in the NZE. In contrast to the heavy industries, most of the technologies required for deep emission reductions in these sub sectors are available on the market and ready to deploy. This is in part because more than 90% of total heat demand is low/medium temperature, which can be more readily and efficiently electrified.
Figure 3.20 Share of heating technology by temperature level in light industries in the NZE
|
Low/medium temperatureheat demand by technology |
|
|
|||
2020 |
|
Technology |
||||
|
|
|
|
|
Fossil fuel heater |
|
|
|
|
|
|
||
2030 |
|
|
|
|
|
Biomass heater |
|
|
|
||||
2050 |
|
|
|
|
|
Electric heater |
|
|
|
|
|
||
|
|
|
|
|
Hydrogen heater |
|
|
High temperatureheat demand by technology |
|
|
|
|
|
2020 |
|
|
|
|
Heat pump |
|
|
|
|
||||
|
|
|
|
|
Other heat sources |
|
|
|
|
|
|
||
|
|
|
||||
2030 |
|
|
|
|
|
|
2050 |
|
|
|
|
|
Sub sectors |
||
|
Heat demandbysub sector |
|
|
|
|
|
|
Mining and construction |
|
|
|
|
|
|
|
||
2020 |
|
|
|
|
|
|
Food and tobacco |
|
|
|
|
|
|
|
|
||
|
|
|
|
|
|
|
Machinery |
|
|
|
|
|
|
|
|||
2030 |
|
|
|
|
|
|
|
Textile and leather |
|
|
|
|
|
|
|||
2050 |
|
|
|
|
|
|
|
Transport equipment |
|
|
|
|
|
|
|||
25% |
50% |
75% |
100% |
|
Wood and wood products |
|||
|
||||||||
|
||||||||
|
|
|||||||
IEA. All rights reserved.
The share of electricty in satisfying heat demand for light industries rises from less than 20% today to around 40% in 2030 and about 65% in 2050
Notes: Light industries excludes non specified industrial energy consumption. Low/medium temperature heat corresponds to 0 400 °C and high temperature heat to >400 °C. Other heat sources includes solar thermal and geothermal heaters, as well as imported heat from the power and fuel transformation sector.
Electricity accounts for around 40% of heat demand by 2030 and about 65% by 2050. For low (<100 °C) and some medium (100 400 °C) temperature heat, electrification includes an important role for heat pumps (accounting for about 30% of total heat demand in 2050). In the NZE, around 500 MW of heat pumps need to be installed every month over the next 30 years. Along with electrification, there are smaller roles for hydrogen and bioenergy for high temperature heat (>400 °C), accounting for around 20% and around 15% respectively of total energy demand in 2050 (Figure 3.20). The rate of electrolyser capacity deployment is much lower than heavy industries, but the unit sizes will also be
128 |
International Energy Agency | Special Report |

much smaller. About 5% of heat demand is satisfied by direct use of renewables, including solar thermal and geothermal heating technologies.
Energy efficiency also plays a critical role in these manufacturing industries, notably through increased efficiency in electric motors (conveyers, pumps and other driven systems). By 2030, 90% of the motor sales in other industries are Class 3 or above.
3.5.2Key milestones and decision points
Table 3.3 |
Key milestones in transforming global heavy industry sub-sectors |
||||
Category |
|
|
|
|
|
Heavy industry |
2035: virtually, all capacity additions are innovative low emissions routes. |
|
|||
|
|
|
|
|
|
Industrial motors |
2035: all electric motors sales are best in class. |
|
|
|
|
|
|
|
|
|
|
Category |
|
|
2020 |
2030 |
2050 |
|
|
|
|
|
|
Total industry |
|
|
|
|
|
Share of electricity in total final consumption |
21% |
28% |
46% |
||
Hydrogen demand (Mt H2) |
51 |
93 |
187 |
||
CO2 captured (Mt CO2) |
3 |
375 |
2 800 |
||
|
|
|
|
|
|
Chemicals |
|
|
|
|
|
Share of recycling: reuse in plastics collection |
17% |
27% |
54% |
||
|
reuse in secondary production |
8% |
14% |
35% |
|
Hydrogen demand (Mt H2) |
46 |
63 |
83 |
||
with on site electrolyser capacity (GW) |
0 |
38 |
210 |
||
Share of production via innovative routes |
1% |
13% |
93% |
||
CO2 captured (Mt CO2) |
2 |
70 |
540 |
||
|
|
|
|
|
|
Steel |
|
|
|
|
|
Recycling, re use: scrap as share of input |
32% |
38% |
46% |
||
Hydrogen demand (Mt H2) |
5 |
19 |
54 |
||
with on site electrolyser capacity (GW) |
0 |
36 |
295 |
||
Share of primary steel production: hydrogen based DRI EAF |
0% |
2% |
29% |
||
|
iron ore electrolysis EAF |
0% |
0% |
13% |
|
|
CCUS equipped processes |
0% |
6% |
53% |
|
CO2 captured |
|
|
1 |
70 |
670 |
|
|
|
|
|
|
Cement |
|
|
|
|
|
Clinker to cement ratio |
0.71 |
0.65 |
0.57 |
||
Hydrogen demand (Mt H2) |
0 |
2 |
12 |
||
Share of production via innovative routes |
0% |
9% |
93% |
||
CO2 captured (Mt CO2) |
0 |
215 |
1 355 |
||
|
|
|
|
|
|
Note: DRI = direct reduced iron; EAF = electric arc furnace. |
|
|
|
||
From 2030 onwards, all new capacity additions in industry in the NZE feature near zero emissions technologies. Much of the heavy industry capacity that will be added and replaced
Chapter 3 | Sectoral pathways to net-zero emissions by 2050 |
129 |
3
IEA. All rights reserved.