

514 |
CHAPTER 6. INTRODUCTION TO INDUSTRIAL INSTRUMENTATION |
6.4.2Recorders
Another common “auxiliary” instrument is the recorder (sometimes specifically referred to as a chart recorder or a trend recorder ), the purpose of which is to draw a graph of process variable(s) over time. Recorders usually have indications built into them for showing the instantaneous value of the instrument signal(s) simultaneously with the historical values, and for this reason are usually designated as indicating recorders. A temperature indicating recorder for the nuclear reactor system shown previously would be designated as a “TIR” accordingly.
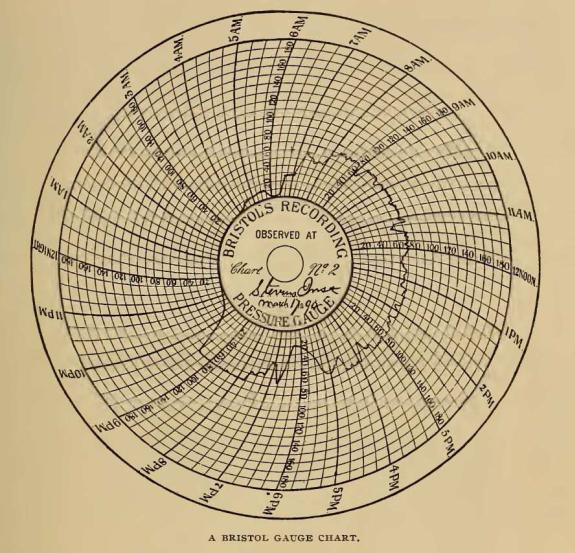
Paper chart recorders are a form of instrumentation with a long history. The following image shows an illustration of a Bristol brand recording pressure gauge found on page 562 of Cassier’s Magazine volume 8, published in 1895. Note the circular form of the paper chart, allowing the pen to draw a trace as the circular chart slowly spins. A padlock on the front glass cover prevents tampering with the chart recording:
6.4. OTHER TYPES OF INSTRUMENTS |
515 |
A typical chart from one of these recording devices is shown in this illustration, taken from page 563 of the same engineering periodical:
This particular recording is of a steam boiler’s pressure over a 24-hour period, showing pressure build-up beginning at 4:00 AM and boiler shut-down at 9:30 PM. This steam boiler’s pressure appears to have been operated at approximately 70 PSI. Dips and peaks in the trace reflect changes in steam demand as well as irregularities in the firing of the boiler’s coal furnace.
516 |
CHAPTER 6. INTRODUCTION TO INDUSTRIAL INSTRUMENTATION |
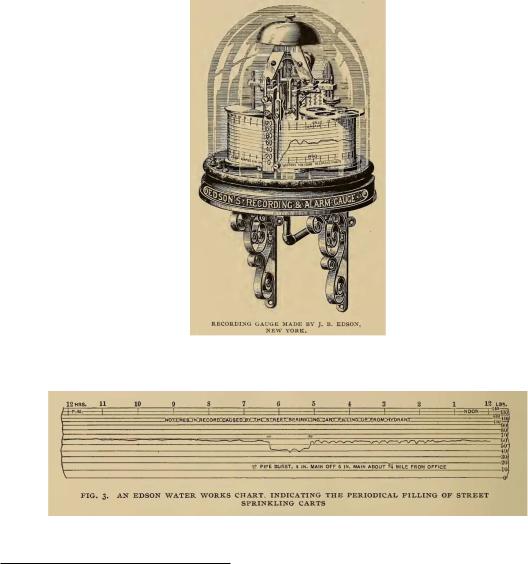
Another design of paper chart recorder is the strip style, using a long strip of paper between two spools (one to play out the paper and another to take it up). Like the circular chart recorder design, the strip chart recorder also has a long history. The following illustration from page 560 of the same
Cassier’s Magazine volume:
This next image shows a practical example of a strip chart’s record for a city water supply company, taken from page 566 of the same periodical:
Several interesting details2 may be seen on this particular recording, including pressure fluctuations caused by periodic draws of water from a fire hydrant to fill street carts used to spray
2Many interesting points may be drawn from these two illustrations. Regarding the strip chart recording instrument itself, it is worth noting the ornate design of the metal frame (quite typical of machinery design from that era), the attractive glass dome used to shield the chart and mechanism from the environment, and the intricate mechanism used to drive the strip chart and move the pen. Unlike a circular chart, the length of a strip chart is limited only by the diameter of the paper roll, and may be made long enough to record many days’ worth of pressure measurements. The label seen on the front of this instrument (“Edson’s Recording and Alarm Gauge”) tells us this instrument has the ability to alert a human operator of abnormal conditions, and a close inspection of the mechanism reveals a bell
6.4. OTHER TYPES OF INSTRUMENTS |
517 |
the city’s dirt roads with water to minimize dust. Pressure drop caused by a burst 4-inch water pipe is also seen on this recording, between 5:00 PM and 6:15 PM.
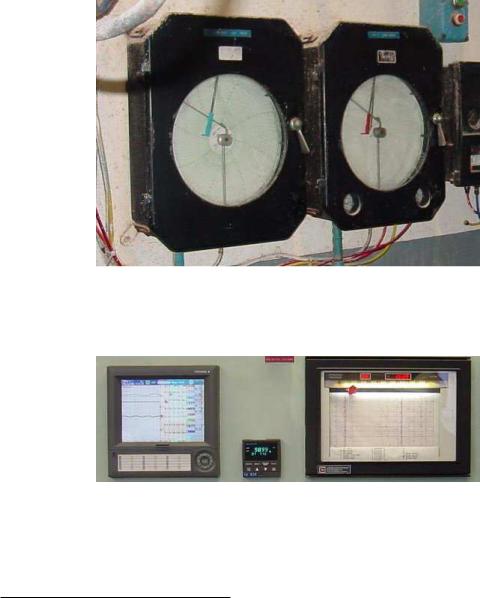
Both circular and strip chart recorder designs survive to this day. Two circular chart recorders are shown in the following photograph, used to record temperatures at a powdered milk processing facility:
Two more chart recorders appear in the next photograph, a strip chart recorder on the right and a paperless chart recorder on the left. The strip chart recorder uses a scroll of paper drawn slowly past one or more lateral-moving pens, while the paperless recorder does away with paper entirely by plotting graphic trend lines on a computer screen:
on the top which presumably rings under alarm conditions. Regarding the strip chart record, note the “compressed” scale, whereby successive divisions of the vertical scale become closer in spacing, reflecting some inherent nonlinearity of the pressure-sensing mechanism.
518 |
CHAPTER 6. INTRODUCTION TO INDUSTRIAL INSTRUMENTATION |
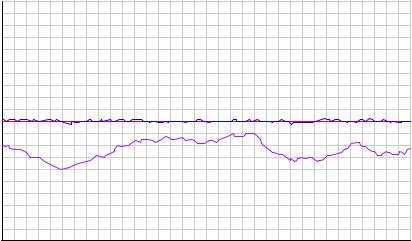
Recorders are extremely helpful for troubleshooting process control problems. This is especially true when the recorder is configured to record not just the process variable, but also the controller’s setpoint and output variables as well. Here is an example of a typical “trend” showing the relationship between process variable, setpoint, and controller output in automatic mode, as graphed by a recorder:
|
100 |
|
|
|
95 |
|
|
|
90 |
|
|
|
85 |
|
|
|
80 |
|
|
|
75 |
|
|
|
70 |
|
|
|
65 |
|
|
|
60 |
PV |
|
% |
55 |
||
50 |
|||
SP |
|||
|
45 |
||
|
40 |
|
|
|
35 |
|
|
|
30 |
Output |
|
|
25 |
||
|
20 |
|
|
|
15 |
|
|
|
10 |
|
|
|
5 |
|
|
|
0 |
|
Time 
Here, the setpoint (SP) appears as a perfectly straight red line, the process variable as a slightly erratic blue line, and the controller output as a moderately erratic purple line. We can see from this trend that the controller is doing exactly what it should: holding the process variable value close to setpoint, manipulating the final control element as far as necessary to do so. The chaotic appearance of the output signal is not really a problem, contrary to most peoples’ first impression. The fact that the process variable never deviates significantly from the setpoint tells us the control system is operating quite well. What accounts for the erratic controller output, then? The answer to this question is any factor requiring the controller to change its output in order to maintain the process variable at setpoint. Variations in process load would account for this: as other variables in the process change over time, the controller is forced to compensate for these variations in order to ensure the process variable does not drift from setpoint. Referencing our previous example of a steam boiler water level control system, one of these influencing variables is steam demand. If this trend shows the steam drum water level (PV) and feedwater valve position (Output), variations in the controller’s output signal could be indicative of steam demand rising and falling, the controller modulating water flow into the boiler to properly compensate for this load and maintain a fairly constant steam drum water level. A wildly-fluctuating output signal may indicate a problem somewhere else in the process (placing undue demands on the control system), but there is certainly no problem with the control system itself: it is doing its job perfectly well.
Recorders become powerful diagnostic tools when coupled with the controller’s manual control mode. By placing a controller in “manual” mode and allowing direct human control over the final control element (valve, motor, heater), we can tell a lot about a process. Here is an example of a
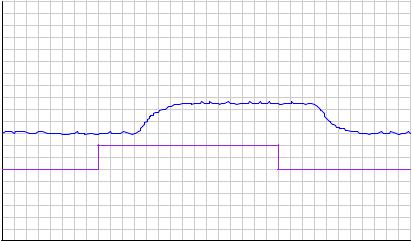
6.4. OTHER TYPES OF INSTRUMENTS |
519 |
trend recording for a process in manual mode, where the process variable response is seen graphed in relation to the controller output as that output is increased and decreased in steps:
100 |
|
|
95 |
|
|
90 |
|
|
85 |
|
|
80 |
|
|
75 |
|
|
70 |
|
|
65 |
|
|
60 |
|
|
% 5055 |
PV |
|
45 |
||
|
||
40 |
|
|
35 |
|
|
30 |
Output |
|
25 |
||
20 |
|
|
15 |
|
|
10 |
|
|
5 |
|
|
0 |
|
Time 
Notice the time delay between when the output signal is “stepped” to a new value and when the process variable responds to the change. This delay is called dead time, and it is generally detrimental to control system performance. Imagine trying to steer an automobile whose front wheels respond to your input at the steering wheel only after a 5-second delay! This would be a very challenging car to drive. The same problem plagues any industrial control system with a time lag between the final control element and the transmitter. Typical causes of this problem include transport delay (where there is a physical delay resulting from transit time of a process medium from the point of control to the point of measurement) and mechanical problems in the final control element.