

01 POWER ISLAND / 02 H2+NH3 / Royal Swiss 2024 Techno-Economic Analysis of Wind Power-to-Hydrogen
.pdf
|
|
4.1.1 Trucks |
50 |
|
|
4.1.2 Machines |
50 |
|
|
4.1.3 Transition Process |
51 |
5 |
METHODOLOGY |
52 |
|
|
5.1 |
Pre-Processing and Transformation of Data |
52 |
|
|
5.1.1 Electricity Production from Wind Farm |
52 |
|
|
5.1.1.1 Wind Farm Connected to Grid |
52 |
|
|
5.1.2 Hydrogen Production Facility |
53 |
|
|
5.1.2.1 Operational Process of Electrolyzer |
53 |
|
|
5.1.2.2 Operational Process of Compressor |
54 |
|
|
5.1.2.3 Total Variable Operational Process of Hydrogen Facility |
54 |
|
|
5.1.2.4 Break-even Spot Price |
55 |
|
5.2 |
Economic Modeling Tools |
56 |
|
|
5.2.1 Contribution Margin |
56 |
|
|
5.2.2 Opportunity Cost |
56 |
|
|
5.2.3 Annuity Method |
56 |
6 |
RESULTS |
57 |
|
|
6.1 |
Simulations of Hydrogen Production |
57 |
|
|
6.1.1 Annual Hydrogen Production |
57 |
|
|
6.1.2 The Profitability of Power-to-Hydrogen Park |
59 |
|
6.2 |
Hydrogen Demand of Gävle Harbor |
60 |
7 |
DISCUSSION AND CONCLUSIONS |
61 |
|
|
7.1 |
Discussion |
61 |
|
7.2 |
Conclusions |
63 |
8 |
FUTURE WORK |
64 |
|
Bibliography |
65 |
||
APPENDIX |
70 |
||
9

LIST OF FIGURES
Figure 1 Hydrogen molecule |
16 |
||
Figure 2 Phase diagram of hydrogen molecule |
16 |
||
Figure 3 General illustration of various fuel cells operating principles |
20 |
||
Figure 4 General illustration of various fuel cells operating principles |
21 |
||
Figure 5 Generalized configuration of a Power-to-Hydrogen process |
21 |
||
Figure 6 |
Map of Sweden, including bidding areas |
22 |
|
Figure 7 |
Shows installation of wind power plants in different countries |
23 |
|
Figure 8 |
Shows the physical development pf wind turbines |
24 |
|
Figure 9 |
Shows the interaction between the different units |
25 |
|
Figure 10 Illustration of AWE and its operating principles |
28 |
||
Figure 11 |
Illustration of PEM and its operating principles |
29 |
|
Figure 12 |
Types of hydrogen storage technologies |
31 |
|
Figure 13 |
Sketch of different tank types for physical storage of hydrogen gas |
33 |
|
Figure 14 |
General sketch of HRS |
34 |
|
Figure 15 A visual presentation of H2 transportation costs with regards to distribution distance [km] (x-axis) and volume [€/kg] (y-axis). Note that costs include movement, compressor and the
storage used |
35 |
Figure 16 Wind farm connected both to the grid and hydrogen facility by electric cables |
38 |
Figure 17 Power curve of a singular turbine for the years 2019, 2021 and 2020 |
39 |
Figure 18 Hourly power production for the year 2019 (A), 2020 (B) and 2021 (C) |
39 |
Figure 19 Durability diagram year 2019 |
40 |
Figure 20 Durability diagram year 2019 |
40 |
Figure 21 Durability diagram year 2019 |
40 |
Figure 23 Shows a simplified flowchart of the H2 production facility’s operational process |
53 |
Figure 24 Simulation of Spot Price Year 2019 |
58 |
Figure 25 Simulation of Spot Price Year 2020 |
58 |
Figure 26 Simulation of Spot Price Year 2021 |
59 |
Figure 27 Simulation of Wind Speed Year 2019 |
58 |
Figure 28 Simulation of Wind Speed Year 2020 |
58 |
Figure 29 Simulation of Wind Speed Year 2021 |
59 |
Figure 30 Hydrogen production at spot price <49.3 [€/MWh] |
77 |
Figure 31 Hydrogen production at spot price <69.2 [€/MWh] |
77 |
Figure 32 Hydrogen production at spot price <89.13 [€/MWh] |
78 |
Figure 33 Hydrogen production at spot price <109.1 [€/MWh] |
78 |
Figure 34 Hydrogen production at spot price <129 [€/MWh] |
79 |
Figure 35 Hydrogen production at spot price <50.7 [€/MWh] |
79 |
Figure 36 Hydrogen production at spot price <70.7 [€/MWh] |
80 |
Figure 37 Hydrogen production at spot price <90.6 [€/MWh] |
80 |
Figure 38 Hydrogen production at spot price <110.5 [€/MWh] |
81 |
Figure 39 Hydrogen production at spot price <130.5 [€/MWh] |
81 |
Figure 40 Hydrogen production at spot price <52.3 [€/MWh] |
82 |
Figure 41 Hydrogen production at spot price <72.2 [€/MWh] |
82 |
Figure 42 Hydrogen production at spot price <92.2 [€/MWh] |
83 |
Figure 43 Hydrogen production at spot price <112.1 [€/MWh] |
83 |
Figure 44 Hydrogen production at spot price <132.1 [€/MWh] |
84 |
10

LIST OF TABLES
Table 1 Hydrogen fuel consumption and road range categorized by vehicle type |
19 |
|
Table 2 Technical and economic information about light-weighted hydrogen |
|
|
fueled vehicles |
19 |
|
Table 3 Total annual wind power production per bidding area |
22 |
|
Table 4 |
Total annual hydro power production per bidding area |
22 |
Table 5 |
Average spot price per bidding area |
23 |
Table 6 |
Conventional hydrogen production methods and the respective advantages, |
|
disadvantages, efficiency and hydrogen production cost |
27 |
|
Table 7 |
Investment costs (CAPEX) for electrolyzers at different scenarios year 2020 |
27 |
Table 8 Investment costs (CAPEX) for compressor with short term (on-site) storage at different
capacities in year 2020 |
|
30 |
Table 9 Investment cost for different types of compressed gaseous hydrogen storage |
33 |
|
Table 10 Estimated Investment Cost for Hydrogen |
35 |
|
Table 11 2.3 MW turbine’s power output with respect to wind speed |
39 |
|
Table 12 Fixed and variable cost of the offshore wind |
40 |
|
Table 13 Technical Parameters for all PEM Electrolyzer |
43 |
|
Table 14 Investment and BoP costs for all PEM Electrolyzers |
43 |
|
Table 15 Technical Parameters for all Compressor Units |
44 |
|
Table 16 Investment cost for all Compressor Units for the year 2020 |
44 |
|
Table 17 Technical and Economic Parameters for Tank Type I |
45 |
|
Table 18 Investment cost for HRS 700-bar on-board storage |
45 |
|
Table 19 Total investment cost for PtH plant |
including 5 MW electrolyzer |
46 |
Table 20 Total Investment Cost for PtH plant |
Including 10 MW Electrolyzer |
46 |
Table 21 Total Investment Cost for PtH plant |
Including 20 MW electrolyzer. |
47 |
Table 22 Power fee for the 100 MW wind Park for Different Years |
47 |
|
Table 23 Energy fee based on target year, average spot price, loss coefficient |
|
|
and risk Factor |
|
48 |
Table 24 Electricity certificate for different years |
48 |
|
Table 25 Data of diesel engine and Fuel cell, and the corresponding fuels |
50 |
|
Table 26 Specific Data and Information Regarding the machines Operating |
|
|
in Gävle Habor |
|
50 |
Table 27 Daily hydrogen demand based on transition stage |
51 |
|
Table 28 Average Wind Speed at Eggegrund A |
52 |
|
Table 29 Breakeven Spot price as function of hydrogen selling price for year 2019 |
55 |
|
Table 30 Breakeven Spot price as function of hydrogen selling price for year 2020 |
55 |
|
Table 31 Breakeven Spot price as function of hydrogen selling price for year 2021 |
55 |
|
Table 32 Parameters of Annuity Method |
|
56 |
Table 33 Annual income generated for 5 MW, 10 MW and 20 MW facilities in year 2019, where
hydrogen price ranges from 3–7 €/kg |
57 |
Table 34 Annual income generated for 5 MW, 10 MW and 20 MW facilities in year 2020, where
hydrogen price ranges from 3–7 €/kg |
57 |
Table 35 Annual income generated for 5 MW, 10 MW and 20 MW in year 2021, where |
|
hydrogen price ranges from 3–7 €/kg |
57 |
Table 36 Profit generated from hydrogen sales 5 MW, 10 MW and 20 MW in 2019, hydrogen
price ranges from 3–7 €/kg |
59 |
Table 37 Profit generated from hydrogen sales 5 MW, 10 MW and 20 MW in 2020, hydrogen
price ranges from 3–7 €/kg |
60 |
Table 38 Profit generated from hydrogen sales 5 MW, 10 MW and 20 MW in 2021, hydrogen
price ranges from 3–7 €/kg |
60 |
11

Table 39 Average TS contribution of the three different PtH plant s |
60 |
Table 40 Profitable hydrogen production, 5 MW, in year 2019, where hydrogen price ranges |
|
from 3–7 €/kg |
71 |
Table 41 Profitable hydrogen production, 5 MW, in year 2020, where hydrogen price ranges |
|
from 3–7 €/kg |
71 |
Table 42 Profitable hydrogen production, 5 MW, in year 2021, where hydrogen price ranges |
|
from 3–7 €/kg |
71 |
Table 43 Profitable hydrogen production, 10 MW, in year 2019, where hydrogen price |
|
ranges from 3–7 €/kg |
72 |
Table 44 Profitable hydrogen production, 10 MW, in year 2020, where hydrogen price |
|
ranges from 3–7 €/kg |
72 |
Table 45 Profitable hydrogen production, 10 MW, in year 2021, where hydrogen price |
|
ranges from 3–7 €/kg |
72 |
Table 46 Profitable hydrogen production, 20 MW, in year 2019, where hydrogen price |
|
ranges from 3–7 €/kg |
73 |
Table 47 Profitable hydrogen production, 20 MW, in year 2020, where hydrogen price |
|
ranges from 3–7 €/kg |
73 |
Table 48 Profitable hydrogen production, 20 MW, in year 2021, where hydrogen price |
|
ranges from 3–7 €/kg |
73 |
Table 49 Profit generated from hydrogen production, 5 MW, in 2019, hydrogen price ranges |
|
from 3–7 €/kg |
74 |
Table 50 Profit generated from hydrogen production, 5 MW, in 2020, hydrogen price ranges |
|
from 3–7 €/kg |
74 |
Table 51 Profit generated from hydrogen production, 5 MW, in 2021, hydrogen price ranges |
|
from 3–7 €/kg |
74 |
Table 52 Profit generated from hydrogen production, 10MW,in 2019, hydrogen price ranges |
|
from 3–7 €/kg |
75 |
Table 53 Profit generated from hydrogen production, 10MW,in 2020, hydrogen price ranges |
|
from 3–7 €/kg |
75 |
Table 54 Profit generated from hydrogen production, 10MW,in 2021, hydrogen price ranges |
|
from 3–7 €/kg |
75 |
Table 55 Profit generated from hydrogen production, 20MW,in 2019, hydrogen price ranges |
|
from 3–7 €/kg |
76 |
Table 56 Profit generated from hydrogen production, 20MW,in 2020, hydrogen price ranges |
|
from 3–7 €/kg |
76 |
Table 57 Profit generated from hydrogen production, 20MW,in 2021, hydrogen price ranges |
|
from 3–7 €/kg |
76 |
Table 58 Data of Truck’s diesel consumption and the corresponding |
|
hydrogen consumption |
85 |
Table 59 Technical Data of Forklifts, ranging from lightto heavyweight |
85 |
Table 60 Technical Data of reachstackers, ranging from lightto heavyweight |
85 |
Table 61 Technical Data of Wheel Loaders |
85 |
Table 62 Technical Data of Terminal Tractor |
86 |
Table 63 Composition of vehicles at different hydrogen transition stages, where TS = Transition
Stage and OW = operating weight |
86 |
12

CHAPTER 1. INTRODUCTION
1.1 Background
Over the course of time, the concept sustainability has gained considerable traction across diverse sectors. Nowadays, it is often taken into account and implemented when addressing different types of challenges, with the aim of generating effective and long-term solutions. One example is the challenge of humans’ daily activities that are negatively impacting the environment. Thus, the awareness for environmental matters has increased, which has sparked an ambition to explore environmentally friendly alternatives to replace non-environmental and unsustainable methods. An area of interest is the industrial productions, where the current mission is to transition from non-sustainable controversial production methods to sustainable and eco-friendly alternatives. This mission is also one of the United Nations' global sustainable development goals [2]. Another goal involves the energy sector, where the aim is to install more renewable energy sources (RES) and use the generated green electricity to supply the grid, and production facilities and the transport sector as end-users. In the transportation sector, green fuel, e.g., hydrogen produced from a waterelectrolyzer, powered by RES, can become a substitute fuel to fossil fuels such as diesel.
European Climate Law has the climate target of reducing net greenhouse gas emissions by 55% by 2030 and achieving climate neutrality by 2050. This will be achieved by investing in green technologies, preserving the natural environment, and reducing emissions [3].
According to the international Energy Agency (IEA), the CO2-emissions from the transport sector has grown by an annual average rate of approximately 1.7% from 1990 to 2021, which is faster than any other end-user sector [4]. Furthermore, compared to other sectors, the transportation sector is most reliant on fossil fuels and in 2021 was responsible for 37% of CO2-emissions from end-users [5]. Thus, making the carbon-emission free green hydrogen an attractive fuel option. Moreover, in comparison to other fuels, hydrogen is a promising future fuel as it exhibits the highest heating value per mass (142 MJ/kg) and creates no environmentally harmful substances when combusted [6]. Additionally, hydrogen also has the capacity to function as a large-scaled storage medium of renewable energy. However, hydrogen gas is difficult to store due to its low volumetric density.
The degree of complexity associated with implementing sustainable solutions can vary greatly. For instance, the transport sector faces challenges such as high investment costs and limited infrastructure. Thus, complicating the transitioning process from fossil fuels to hydrogen. The challenge lies in encouraging stakeholders to invest in hydrogen refueling stations (HRS) installations and convincing drivers to switching over to hydrogen-fueled cars.
In theory, increasing installation of RES, such as, wind turbines, hydro power, and photovoltaic facilities, would correspondingly expand the accessibility of green hydrogen. However, the achievement of enhancing the accessibility to green hydrogen is constrained by several factors, including the fluctuation of some renewable power sources, limited commercially available of efficient hydrogen production technologies, and the high capital investment of equipment and infrastructure, among others. Proposed solutions to tackle these types of challenges are for example the installation of large-scale hydrogen storage to compensate for seasonal imbalances of intermittent energy sources and the optimization of equipment dimensions to reduce investment costs. Nevertheless, these initiatives are hindered by limited access to data and information regarding operation of large-scale green hydrogen production facility, thereby creating obstacles in terms of identifying potential risks and unpredicted costs. Despite these challenges, the
13

favorable properties of hydrogen as an energy carrier have motivated the pursuit of projects such as HYBRIT and Mid Sweden Hydrogen Valley. HYBRIT is a project collaboration between different large companies such as SSAB, Vattenfall and LKAB. The project’s aim is to produce fossil-free steel using green hydrogen. The Mid Sweden Hydrogen Valley project is described in section 2.4. Therefore, the purpose of this thesis is to execute an investment calculation of a green project involving operation of a hydrogen production facility powered by a renewable energy source.
1.2 Aim
The aim of this research is to conduct a comprehensive techno-economic analysis of a large-scale hydrogen production facility, where a water electrolysis is powered by an offshore wind farm. The aim is to investigate whether it is more economic profitable to utilize the electricity generated from the wind farm to operate a hydrogen production plant, i.e., to produce and sell hydrogen over selling the electricity directly to the grid. Therefore, the execution of this investigation will be carried out by dividing the utilization of electricity into two different alternatives as seen below:
Alternative 1: Produce green hydrogen and sell it to designated customer when the contribution margin is positive.
Alternative 2: Directly sell the electricity to the grid.
The objective is to produce and sell green hydrogen as long as the contribution margin is positive. However, when the hydrogen production is no longer profitable, then the electricity will instead be sold to the grid.
To accomplish this techno-economic analysis, a case study of a Power-to-Hydrogen (PtH) plant will be conducted, where three different sizes of PtH plant will be produced, analyzed, and compared to each other. The purpose is to determine which facility size offers the most favorable economic outcome.
1.3 Delimitations
This master thesis is limited by several factors, where the primary ones are the time available for conduct it and the complexity of operating a PtH plant. These two factors go in hand in terms of the significant time required to identify and investigate all components and the corresponding operational parameters, involved in such facility. Furthermore, to accurately understand and quantify these operational parameters, advanced simulations are necessary. Moreover, in many cases there is, for example, a lack of information about the capital cost of the different components.
Overall, knowledge about operating a PtH plant is highly limited due to the PtX concept still being in the development phase. However, the purpose of this report is to provide a holistic description of the operational process by constructing a simplified hydrogen production facility connected to a wind farm, where the primary focus is on the main components. This is due to two reasons, where the first reason is that these components significantly impact the resulting outcome, and secondly there are sufficient information available about the main components in literature. In addition to this, consideration for hydrogen losses in different systems, which is an important factor, has not been considered in this report.
14

1.4 Method
The framework of this report is structured in such way that the initial step involves gathering technical and economic information about wind power and hydrogen production facility through literature research. The purpose is to gain knowledge about the technologies, electricity market, and capital costs, and to identify relevant equipment that are used for hydrogen production and storage, which all are presented in chapter 2. This knowledge will then be used to construct a Power-to-Hydrogen facility, where its performance in terms of the technical and economic aspects will be analyzed by studying various cases in chapter 3. In chapter 4, the potential costumer is discussed. Thereafter, the operational process, varying cost, and income of the constructed PtH plant’s components are mathematically described by equations in chapter 5. The framework ends with a presentation of results generated by MATLAB and Python, in chapter 6. These results will be analyzed and discussed before drawing a conclusion in chapter 7, along with suggestions for future work in chapter 8.
15
CHAPTER 2. LITTERATURE RESREACH
2.1 Hydrogen
The atomic structure of hydrogen, denoted by its chemical symbol H, consists of a lone electron and a single proton in the atomic nucleus, with no neutrons present. Its atomic mass is 1.008 g/mol, which makes hydrogen the lightest element in the periodic table. Additionally, hydrogen is the most abundant element as it constitutes approximately 75% of the universe's elemental mass [7]. In molecular form, hydrogen is a diatomic molecule as visualized in Figure 1, which is the lightest known molecule, where its molecular mass is 2.016 (g/mol). However, due to its reactive nature, the H2 molecule does not occur naturally on earth, and thus must be artificially produced [6][8].
Figure 1. Hydrogen Molecule [9].
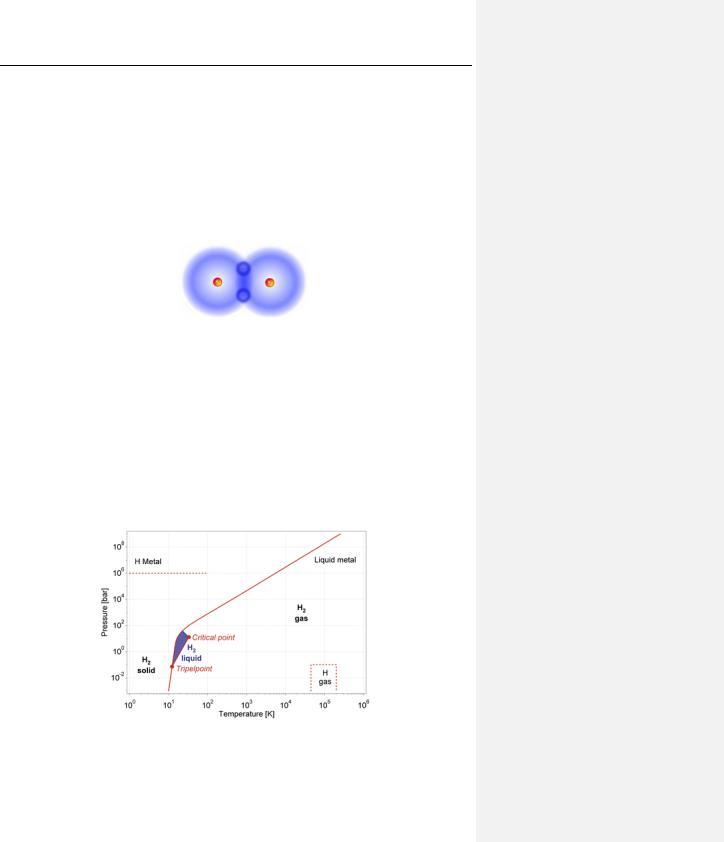
At different temperatures and pressures, the hydrogen molecule will change its state of matter according to the phase diagram in Figure 2. As shown in figure 2, hydrogen becomes solid at low temperatures (11 K) and obtains a density of 70.6 kg/m3, while at a higher temperature and pressure (273 K and 1 bar), it becomes a gas with a density of 0.0899 kg/m3 [6]. The density of gaseous
hydrogen ( 2= 0. 0899 kg/m3) is approximately 14 times lower than that of air ( = 1.225 kg/m3), at the same conditions [10]. Moreover, at ambient temperature (298.15 K) and atmospheric
pressure (1 atm), one kilogram of hydrogen can occupy a volume of over 11 m3 [11]. Furthermore, between the solid and gas phase, there is a small-marked zone where hydrogen becomes a liquid. This zone starts at the triple point and ends at the critical point. Liquid hydrogen has the density of 70.8 kg/m3 at 20 K [6].
Figure 2. Phase diagram of hydrogen molecule [6].
16

2.2 Hydrogen Applications
Hydrogen is mainly used as a feedstock and a reducing agent for, e.g., reduction reactions in refineries [12]. However, due to its desirable properties, hydrogen has become a valuable resource within different sectors (industry, transport, and energy sector). These properties include, for example, high gravimetric energy density, no greenhouse gas emissions upon combustion, regenerative nature, and versatility, among others. In the energy sector, hydrogen can function as an energy carrier by operating as a storage medium for intermittent energy sources (RES) and reproduce electricity on demand through fuel cell technology [6][13]. In the transportation and industry sectors, hydrogen can be used as fuel and feedstock, respectively.
This thesis will solely review hydrogen application within the transportation sector. However, a brief overview of hydrogen application within industry and energy sector will be presented in section 2.2.1 and 2.3.2, respectively.
2.2.1 Industry
In Sweden, more than 90% of hydrogen produced is used as feedstock for a diverse range of industrial processes, thus making it its predominant application. Refineries and the chemical industries represent the main consumers, accounting for 72% and 27% of its consumption, respectively, while the hydrogen refueling stations only consumes 0.2% [14].
In the chemical industry, hydrogen is used as a raw material for various chemical products, where ammonia (Haber-Bosch process) is one example. The utilized hydrogen is typically produced from non-environmentally friendly and unsustainable sources such as fossil fuels, hence the denotation
“grey hydrogen”. Furthermore, grey hydrogen possesses a low degree of purity due to the high formation of by-products [15]. However, the usage of fossil fuels as sources provides certain advantages, including production of inexpensive hydrogen and independence from seasonal production fluctuations other than the changes in natural gas prices. For instance, hydrogen produced via Steam Methane Reforming (SMR) for ammonia production, can cost as low as 1.5 €/kg when disregarding CO2-taxes. Overall, the hydrogen price varies depending on its intended application and the employed production method [14].
The Swedish industry and EU have demonstrated an interest in using green feedstock such as green hydrogen to produce different products, where the aim is achieving a decarbonized production, particularly within the steel and transport industry. The use in the steel industry is foremost due to hydrogen having the potential to serve as a substitute for coal, in terms of reduction of iron oxide (carbon-free steel) and steel heating. Companies that are interested in implementing such method are for example HYBRIT and H2GreenSteel. In addition, the company Ovako aims to start using green hydrogen for the steel rolling process. This will be accomplished by installing 17 MW electrolysis into a steel-production facility located in Hofors, partly financed by the Swedish
Energy Agency. However, according to the Hydrogen Council, the green hydrogen and CO2-tax must cost no more than 1.4 €/kg and no less than 92 €/ton CO2, respectively, for this project to become competitive to, e.g., natural gas [14][16].
Moreover, 51 kg hydrogen is required to produce one ton of steel, which underscores the substantial amount of hydrogen needed to facilitate a large-scale green steel production. This can be exemplified by the production of raw steel in Sweden during 2020, which totaled to 4.4 million tons. To produce such high volume of steel would require 224 million tons of hydrogen. Additionally, in terms of the electricity demand, LKAB has estimated that a direct incorporation of an electrolysis system into the steel production process, would require 55 TWh/year. To put this
17

electricity demand into perspective, 55 TWh/year is equivalent to 1/3 of Sweden's total electricity production. In order for this strategy to become competitive, the spot prices of electricity can at a maximum be 40 €/MWh and the CO2-tax must range between 34 and 68 €/ton CO2. The estimation of a competitive hydrogen cost in such applications varies depending on the research source being viewed. For example, some sources suggest that the cost of hydrogen may range between 2 and
2.5 €/kg, while others estimate it to be between 1.7 and 2.1 €/kg [14]. As previously mentioned, for green hydrogen to compete with conventional production methods, it would need to be priced competitively, as the current cost of grey hydrogen is approximately 1.4 €/kg [14].
2.2.2 Transportation Sector
The Swedish Environmental Protection Agency has estimated that approximately 47.8 million tons of carbon equivalents (CO2e) were released in Sweden during 2021, where the transport sector accounts for 31% of the total greenhouse gas emissions [17]. The high carbon-emissions from the transport sector and oil crisis have sparked an interest in researchers to investigate alternative fuel options to replace fossil fuels. In 1960, experiments with hydrogen as a potential fuel for vehicles were initiated. Today, hydrogen has become an attractive fuel due to offering a rapid refueling time, a lightweight energy storage system and had a prolonged driving range. However, using hydrogen as a fuel is limited by a wide range of factors. These factors are among others, hydrogen infrastructure and the type of vehicle being considered.
In scenarios involving short driving distances and lightweight vehicles (e.g., private cars), dieseloperating and electric-powered vehicles are tough competitors to hydrogen-fueled vehicles. This is partly due to the refueling cost of hydrogen for lightweight vehicles was estimated to range between 4 and 6 €/kg. This pricing is based on maintaining the same total cost for the vehicle over its lifetime as if it was operated on diesel fuel. Diesel for vehicles can cost as low as 2 €/l including tax [18]. Additionally, in terms of “green transportation”, electric cars are more financially viable compared to hydrogen cars. However, hydrogen-fueled vehicles have presented a potential to compete favorably to batteries in the context of heavy vehicles. A couple of factors that contribute to this matter include offering a fast-refueling time, longer driving distances, and a lightweight energy storage, as opposed to the heavy batteries. To this category, trains, trucks, and industrial working machines (e.g., heavy forklifts, >5 tons) are included. Heavy vehicles consume a lot of fuel, and thus making the fuel cost an important factor to consider [14].
One reason industrial working machines are challenging to electrify with batteries is that it is difficult to bring sufficient electricity to construction sites, and these are therefore mostly fueled by diesel. To estimate the hydrogen fuel consumption in industrial working machines, factors such as vehicle size, diesel consumption expressed in liters per hour and its utilization, needs to be considered. An equation to compute the hydrogen fuel consumption of vehicles is expressed in equation (10) [14][19].
C |
H2 consumption |
[ |
kg H2 |
] = |
ηdiesel |
∙ |
Ediesel |
∙ (C |
disesel consumption |
) [ |
l Diesel |
] |
(10) |
|
|
|
|
||||||||||
|
|
h |
|
ηH2 |
|
EH2 |
|
h |
|
||||
|
|
|
|
|
|
|
|
||||||
Where ηdiesel is the efficiency [%] of diesel engine, while ηH2corresponds to the fuel cell’s efficiency [%]. The variable Cdisesel consumption is the amount of diesel consumed, and CH2 consumption is the corresponding hydrogen fuel consumption. The diesel’s energy density is denoted as Ediesel [kWh/l], while hydrogens density is given by EH2[kWh/kg].
Moreover, besides the requirement of a low hydrogen price, other factors influencing hydrogen’s competitiveness to batteries is the current state of accessibility and infrastructure. Specifically,
18