

книги / FISMA and the risk management framework the new practice of federal cyber security
..pdfEvaluating the cohesive strength of a surface material by controlled scratching |
197 |
but displaced from it by a fixed separating distance at increasing load starting from a small value until a critical normal load was reached at which a jump in the AE signal was detected. The cohesive strength of a series of cobalt-based alloys was ranked using this double parallel overlapping scratching technique [16].
Multiple Parallel Overlapping Scratching
Multiple parallel overlapping scratching has been used by the authors for evaluating the cohesive strength of thick coatings or surface materials. As shown in Fig. 4, five or more parallel scratches are made on the finely polished top surface of a specimen by a spherical tipped indenter with a fixed separation distance between adjacent scratches. At light load the scratch groove is narrow and the extent of plastic deformation is small. With increasing normal load, the scratch groove becomes wider. This results in an increase in the ratio of groove width to indenter tip radius, but also in the extent of interaction between scratches so that subsequent scratches are made on an already plastically deformed and damaged surface. Hence, although the extent of plastic deformation and damage is small after the first scratch on the virgin surface, it becomes much more severe after the five parallel scratches. The extent of this surface damage on the specimen surface can then be used as a measure of its cohesive strength, or resistance to micro-fracture. Since this material property is an important factor in determining the resistance of a material to ploughing wear, as well as evaluating its cohesive strength, parallel overlapping scratching can also be used for assessing the material's abrasive wear resistance.
In the multiple parallel overlapping scratching method, cohesive strength in the surface of the scratched specimen is evaluated and compared using the following four parameters:
a.Material lost at specified load. The difference between the volume below and that above the original surface (volumes of scratch groove and scratch side ridges, respectively).
b.Acoustic emission (AE) signal at specified load. The AE signal, recorded continuously by computer, relates directly to the elastic energy released during cracking and fracturing in the scratch test.
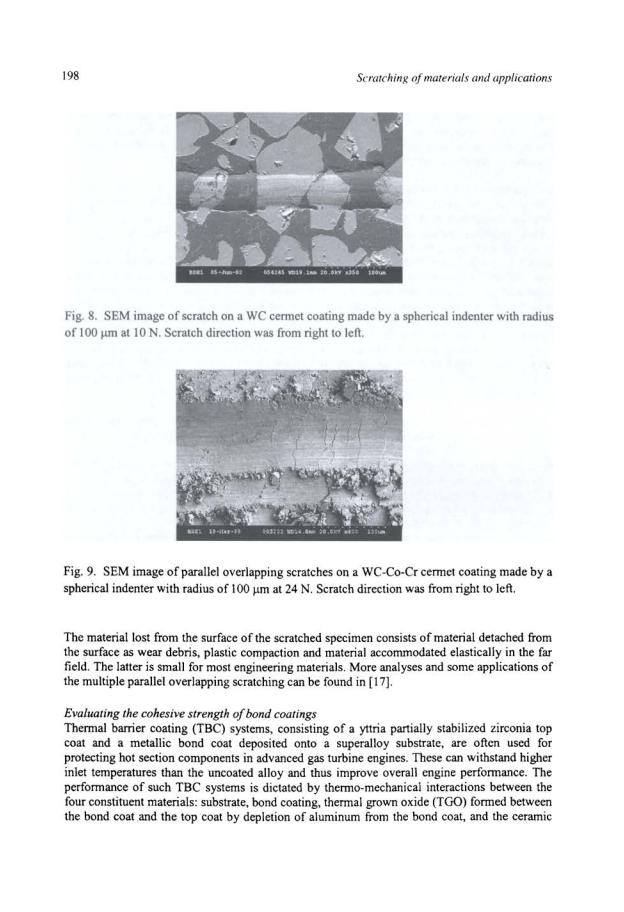
c.Extent of micro-cracking in brittle grains. Figure 8 is an example of such cracking. This depends on both grain strength reduction due to material processing, poor bonding between the hard grains and binder material, etc. It can be estimated qualitatively from SEM examination of scratches at specific load positions.
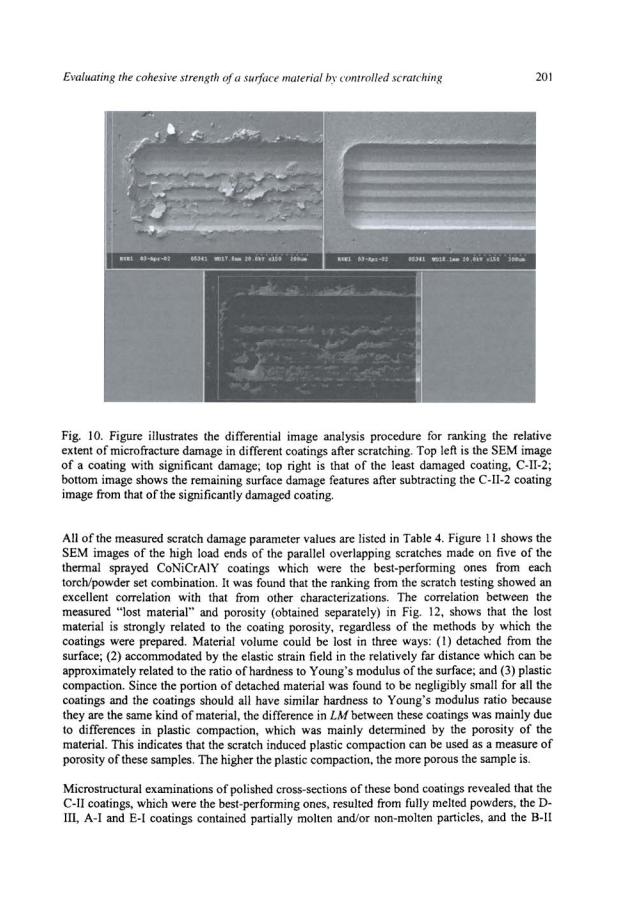
d.Tensile cracks on the bottom of scratch grooves. Since there is a tensile stress field at the trailing edge of the contact between a scratch indenter and the surface, long cracks perpendicular to the scratch direction may appear if the bonding strength of the scratched material is relatively weak, or, if the pre-existing micro-cracks grow and connect with each other, as shown in Fig. 9.
Evaluating the cohesive strength of a surface material hy controlled scratching |
199 |
top coat. One of the important factors that govern TBC system performance is the microstructural integrity of the adjacent bond coat and TGO because, during thermal cycling, the imperfections in the vicinity of the TGO localize the misfit stress and induce a strain energy release rate, and cause small cracks and separations to nucleate. Failure occurs when cracks from neighboring imperfections coalesce and detach the layer over a sufficient area to cause large-scale buckling or edge delamination [18]. Thermal spray coating is the most widely used method to fabricate TBC systems. However, thermal sprayed coatings exhibit porosity, microcracks, partly melted particles and oxide inclusions, all to various extents. Even the best highvelocity oxyfuel sprayed coatings can have defects such as imperfect inter-splat or interlamellar (inter-pass) bonding and thermal cracks. Because of such defects, and the residual stresses resulting from the spray process, TS coating properties are usually inferior to those of corresponding sintered materials. The extent and type of defects in a TS coating depend upon the spray torch and the precurser powder used, and the spraying condition. Good control of these parameters can ensure a minimum number of detrimental microstructural and compositional defects and the resulting good coating cohesive strength, or microstructural integrity. The cohesive strength of TS coatings depends on all factors that determine how well they "hold together" during use. Although some of these factors are difficult to measure individually, a material's cohesive strength is closely related to its resistance to contact deformation and its ability to deform without fracture. In principle, therefore, by inducing severe contact deformation on a specimen surface and then measuring the extent of damage, the cohesive strength ofTS coatings can be evaluated.
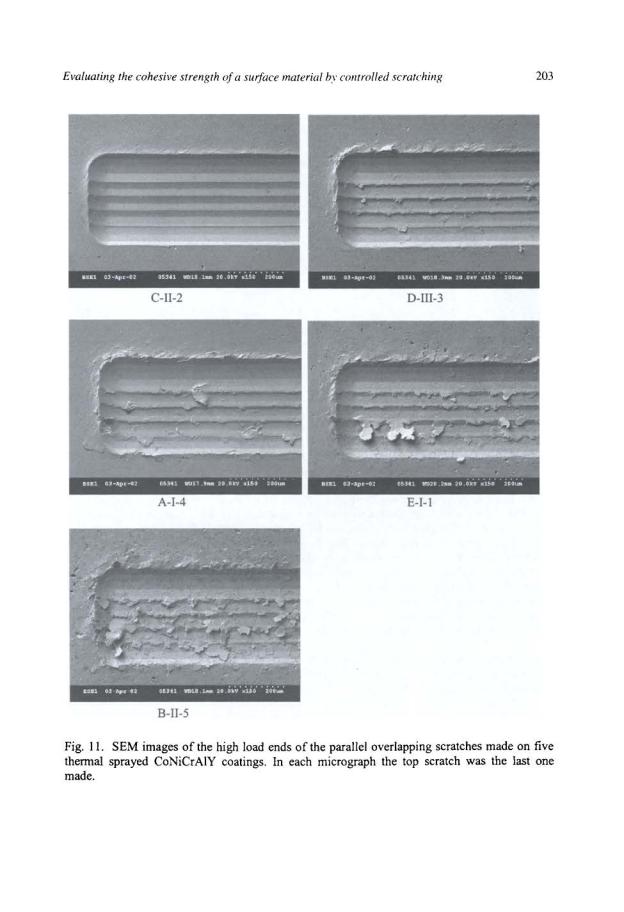
Parallel overlapping scratching was used to rank the relative cohesive strength of thermal sprayed bond coatings prepared using powders with the same composition but from different powder manufacturers, and using different thermal spray torches and different spray parameters. Twenty thermal sprayed CoNiCrAlY bond coatings were tested. The torches, powders and spray conditions used to prepare coatings are listed in Table 4.
The REVETEST scratch tester and a 120° conical diamond indenter with a 200 1-1-m tip radius were used. Scratching speed was 12 mm/min. Five parallel scratches were made on the finely polished top surface of a specimen with a separation distance of 50 1-1-m between adjacent scratches, as shown schematically in Fig. 4. In order to have essentially the same extent of plastic deformation on each sample, the width of scratch grooves was controlled to be about 132 llffi at the end of the first scratch for each sample. This scratch width ensured that the plastic deformation was fully constrained within the thickness of all of the bond coatings. Because the hardnesses of the samples were different, the applied maximum normal loads to produce the 132 1-1-rn scratch grooves were different from sample to sample. This maximum load value was predetermined from a separate single scratch on each sample under a ramping load. These maximum load values for each coating are listed in Table 4. Incidentally, the value of scratch hardness, H5 , was also calculated and listed in Table 4. The scratch hardness is defined as the ratio of normal load to projected load-bearing area (assumed to be the area of a semi-circle) and was determined from the width of the scratch groove as follows
(2)
where P is the normal load and b is the scratch width. An acoustic emission (AE) transducer was used for detecting the surface energy released during scratching.
200 |
Scratching of materials and applications |
The cohesive strength in the different coatings was evaluated and compared using the following four scratch damage measures.
a. Scratch-induced surface damage by differential image analysis. Examination of SEM images of the multiple scratched traces revealed various amounts of damage on most coatings, mainly in the form of partially detached debris at the scratch sides. There was little or no evidence of debris being totally removed from the surfaces, however. Coating C-II-2, which was prepared using the torch C/powder II!spray parameter 2 combination, showed only smooth, plastically deformed scratch traces with no obvious evidence of micro-fracture at their sides. Ranking the relative extent of the microfracture damage on the other coatings was obtained by a differential image analysis procedure. The SEM images of the multiple scratched traces were subjected to image analysis using Optimas software. The image of the C-II-2 coating scratches was subtracted from that of the corresponding image of each of the other coatings and the area fraction of the remaining surface damage features calculated to give a scratch damage severity index that excluded any plastic deformation contributions. For clarity, this differential image analysis procedure is illustrated in Fig. 10.
b. Percentage of lost material. LM. This is given by
LM = V, -V2 |
xiOO% |
(3) |
v; |
|
|
where V1 and V2 are, respectively, the volumes below, and above, the original surface (equal to the appropriate cross-sectional areas multiplied by the scratch length). The volumes were measured using the non-contacting optical 3-D surface imager at a position near the scratch end on each sample after the scratched surface was cleaned of loose debris by a compressed air jet.
c.Acoustic emission signal in the last {5th) scratch. In the test, the AE signal (in arbitrary units) was recorded continuously by computer. Besides the extent of cracking/fracturing, the magnitude of the AE signal is also determined by the yield strength of the surface, the density of the sample, initial residual stress, etc. The harder and denser a material, or, the higher the initial residual stress, the higher the AE signal. Hence, in this case, the AE signal was normalized by
I(AE, I P;)
AE = -'-'':"-'---- |
(4) |
n |
|
where P; is the normal load when recording the AE signal AE;, and n is the total number of data points. Nevertheless, the AE can only be used for ranking samples with closely similar hardness (proportional to yield strength) and LM. When a coating had a relatively high porosity(>- 4%), the detected AE signal was very low. In this case, the AE data was not relevant to micro-fracture.

202 |
Scratching of materials and applications |
coatings which were the worst-performing ones contained partially molten and non-molten particles and oxide inclusions.
Table 4: Torches, powders and spray conditions used to prepare coatings, and all scratch damage parameter values
Torch |
|
|
|
|
|
Surface |
|
AE |
Powder |
Spray |
Maximum |
Hs |
Damage Index |
LM |
(arbitrary |
||
|
|
|
Parameter |
Load |
(GPa) |
(%feature |
(%) |
units) |
|
|
|
|
|
|
area) |
|
|
|
|
|
1 |
40 |
5.90 |
13.7 |
0.67 |
2.76 |
|
|
|
2 |
41 |
5.91 |
10.1 |
0.66 |
2.18 |
A |
|
I |
3 |
37 |
5.44 |
17.0 |
0.61 |
6.33 |
|
|
|
4 |
45 |
6.51 |
8.3 |
0.65 |
5.27 |
|
|
|
6 |
37 |
5.44 |
10 |
0.75 |
2.64 |
B |
|
|
1 |
24 |
3.34 |
14.8 |
0.83 |
0.05 |
II |
8 |
21 |
3.04 |
14.1 |
0.82 |
0.04 |
||
|
|
|
5 |
25 |
3.59 |
13.6 |
0.77 |
0.17 |
c |
|
|
1 |
44 |
6.42 |
0.7 |
0.47 |
4.89 |
II |
1 |
33 |
4.79 |
0 (ref) |
0.31 |
0.82 |
||
|
|
|
3 |
37 |
5.38 |
1.1 |
0.43 |
5.93 |
|
|
|
1 |
26 |
3.86 |
6.1 |
0.76 |
1.42 |
D |
|
|
2 |
39 |
5.70 |
8.1 |
0.56 |
0.96 |
III |
6 |
27 |
3.90 |
8.7 |
0.79 |
2.13 |
||
|
|
|
7 |
37 |
5.46 |
12.0 |
0.55 |
2.20 |
|
|
|
8 |
33 |
4.79 |
5.4 |
0.64 |
1.08 |
|
|
|
3 |
37 |
5.35 |
4.4 |
0.51 |
1.79 |
|
|
|
9 |
24 |
3.46 |
7.4 |
0.88 |
0.11 |
E |
|
I |
I |
27 |
3.85 |
8.9 |
0.84 |
0.06 |
|
|
|
3 |
24 |
3.56 |
8.9 |
0.84 |
0.06 |
Note: Bold numbers indicate the data of the best-performing coatings from each torch/powder set combination.
204 |
|
|
|
|
|
|
Scratchinr, of materials and applications |
||
|
90 |
|
|
|
|
|
|
|
|
|
|
<:><:> |
|
|
•• |
||||
|
80 |
|
|
|
|
|
|||
|
|
|
|
|
|
||||
|
|
|
|
|
|
|
|
|
|
|
|
|
|
• |
|
|
• |
|
|
|
70 |
|
|
,.X |
|
|
|
|
|
';i~ 60 |
|
• |
|
|
|
|
|
||
::2 |
|
|
|
~ |
|
|
|
|
|
...J |
50 |
|
|
|
|
|
|
|
|
|
|
|
|
|
|
|
|
|
|
|
40 |
|
|
|
|
|
|
|
|
|
30 |
|
|
|
|
|
|
|
|
|
20 |
|
|
|
|
|
|
|
|
|
|
|
|
|
|
|
|
|
|
|
0 |
2 |
4 |
6 |
8 |
10 |
|||
Porosity(%)
Fig. 12. Correlation between the measured "lost material" and porosity obtained from separate measurements. The symbols represent different spray and powder combinations.
Evaluating the wear resistance ofthermal sprayed tungsten carbide-based coatings
Thermal sprayed (TS) tungsten carbide (WC)-based coatings are widely used for highly abrasive, or erosive, wear-resistant components. However, such coatings can exhibit porosity, micro-cracks, partly melted particles, oxide inclusions and carbide degradation. It has been found that compositional and microstructural variables, such as phase content and carbide particle size largely determine the sliding, abrasive and erosive wear behaviour of WC cermet coatings, but defects and residual stresses also have an influence [19]. Both high-stress abrasion ofWC coatings [19], and high-energy impact erosion ofWC/Co/Cr coatings with dry sand [20] fractures the carbide phase. Defect-related damage mechanisms were also found important in both dry alumina particle and slurry erosion behaviour of various HVOF cermet coatings [21]. During erosion or abrasion, surfaces sustain repeated interactions with a hard abrasive or erodent medium, such that plastic deformation is accumulated locally, resulting in many microfracture events on the worn specimen surface. Scratch testing has been used to induce repeated plastic deformation in a controlled manner on surfaces and this was shown to approximate closely the contact deformation during abrasion and solid particle erosion [7,4]. The multiple parallel overlapping scratching should, therefore, be capable of evaluating the cohesive strength that relates to the wear resistance of a material.
Two commercially available tungsten carbide-12 weight% cobalt (WC-12Co) powders (MS and C1) were used as the starting materials for preparing the samples. Coatings were deposited on low-carbon steel substrates by thermal spraying using a HVOF system (JPSOOO, Tafa-Praxair Inc., Concord, NH, USA). A wide selection of fuel (kerosene) and oxygen flow settings was employed to produce a range of in-flight particle characteristics (temperature and velocity) and, hence, coatings exhibiting differences in their wear properties. Coatings were deposited at two stand-off distances, 20 em and 38 em. A total of eighteen different powder-spray parameter combinations were employed. The details of the coating preparation were provided in ref. [22].
Single pass, depth-sensing scratching at relatively small load was carried out first to estimate how much material would be "lost" due to plastic compaction. A micro scratch tester (CSM Instruments, Switzerland) was used for this initial scratching. A 200 )lm radius, spherical-tipped
Evaluating the cohesive strength of a surface material by controlled scratching |
205 |
diamond indenter was drawn over the testing surface at a constant normal load of 15 N. The indenter axis was normal to the top surface of the finely polished coating. The indenter geometry and the load ensured that no material was removed from the surfaces and no obvious cracking occurred. The scratch speed was 4 rnrnlmin and the scratch distance was 6 mm. The percentage of lost material caused by plastic compaction, LM, in the scratching was measured by the non-contacting, optical 3-D surface imager and calculated using the Equation 3 given in a previous section. Incidentally, the average value of scratch hardness, Hs was also calculated using Equation 2 given previously. Here the scratch width b was derived from the penetration depth under load, the residual depth after the indenter had been removed and the indenter radius, based on contact mechanics calculation. Both the penetration depth under load and the residual depth after the indenter had been removed were continuously recorded by computer during the scratching.
The REVETEST scratch tester was then used with a 200 ~m radius, spherical-tipped diamond indenter to make five overlapping, parallel scratches, 50 llm apart, on the top surface of the finely polished specimen surfaces. Normal load was ramped from 0 to 100 N over 60 seconds in each 8 mm long scratch. This induced greater coating damage, as plastic deformation accumulated with each overlapping scratch and with increasing load. In this case, the wear resistance of different coatings was evaluated and compared using the following four parameters:
a.The amount of material removed as detached debris. RM, from the surface by this multiple scratching which is given by
(5)
where V1p and V 2p are, respectively, material volumes below and above the original surface per unit scratch length in this parallel scratching. The same as the measurement for LM, RM was determined using the optical surface imager at a position near the scratch end on each sample after the scratched surface was cleaned of loose debris by a compressed air jet.
b.Total acoustic emission count in the last (51h) scratch.
c.Tensile cracks on the bottom of scratch grooves.
d.Extent of surface damage from examination of SEM images of the scratches. The multiple scratched area (end) of each coating specimen was examined by SEM and the severity of damage was estimated visually.
All of the measured scratch damage parameter values, along with the scratch hardnesses, are listed in Table 5. Figure 13 shows the scratched surfaces of the best-performing coatings and one of the poorer performing coatings from each powder.
The performance of the various coatings when subjected to scratching was compared with their three-body abrasive wear behaviour. The performance of the coatings in three-body abrasive wear was evaluated using the standard dry sand rubber wheel abrasion test that involved feeding silica sand between a rotating rubber-coated wheel turning in contact with a WC-12Co coated sample. The test was run over an equivalent lineal distance of 4309 m. The amount of coating removed (volume of the wear scar) during the test was determined using optical profilometry. A comparison of the performance of the various coatings when subjected to three-body dry abrasion and to scratch tests is presented in Fig. 14. In general, the agreement in identifying the

206 |
Scratching of materials and applications |
best-performing coatings using these two tests is very good. The overall best-performing coating was found to be the same in the two tests. It is also interesting to look at the results for the different groups of coatings. For powder 1 (M5), there is agreement for the two techniques in identifying the two best-performing coatings produced at a spray distance of 38 em and the two best coatings sprayed at a distance of 20 em. Similarly, for powder 2, there was agreement between the two techniques regarding the best-performing coating at a spray distance of 38 em and the one at 20 em.
Another approach for comparing the results is to set a performance level as a criterion for accepting or rejecting a coating. For example, in Fig. 14, lines have been drawn to indicate the point where the material removal by abrasion or scratching is 1.3 times that exhibited by the best-performing coating (Cl-38-6). Using this arbitrary performance criterion, it can be seen that the scratch test would have identified five coatings as falling within the acceptance window (i.e., the five coatings with RM values falling below the solid line). The abrasion test would have identified these same five coatings, as well as two additional coatings, as being acceptable (i.e., the seven coatings for which the volume loss in abrasion falls below the dashed line).
This comparison demonstrates that there is good agreement between the results obtained in the standard three-body dry abrasion tests and in controlled scratch testing. Not surprisingly, the relationship is not perfect and the absolute ranking of the performance of the samples as determined using the two techniques does not always agree; however, the general trends correlate and both approaches identify the best-performing coatings.
Table 5: Measured scratch damage parameter values
|
H, |
LM |
RM |
AE |
Tensile |
Extent of |
Sample |
(GPa) |
(%) |
(!lm3/).lm) |
(arbitrary unit) |
Cracks |
Surface |
|
|
|
|
|
|
Dama e * |
M5-38-2 |
8.19 |
14 |
2545 |
1693 |
Many |
4 |
M5-38-17 |
8.69 |
40 |
4125 |
9740 |
Very many |
5 |
M5-38-18 |
10.68 |
-0 |
772 |
1352 |
None |
2 |
M5-38-20 |
10.92 |
-0 |
681 |
1271 |
None |
2 |
M5-38-21 |
8.33 |
18 |
1242 |
1736 |
Many |
3 |
M5-20-5 |
10.57 |
-0 |
642 |
770 |
None |
1 |
M5-20-8 |
10.42 |
-0 |
726 |
1180 |
None |
2 |
M5-20-9 |
10.60 |
11 |
1069 |
1740 |
Some |
3 |
M5-20-10 |
9.94 |
3 |
1044 |
1248 |
Some |
3 |
C1-38-21 |
7.97 |
15 |
3557 |
1668 |
Very many |
5 |
Cl-38-20 |
9.92 |
-0 |
1042 |
712 |
None |
2 |
Cl-38-16 |
9.06 |
-0 |
1145 |
660 |
None |
2 |
C1-38-15 |
9.01 |
-0 |
1613 |
1429 |
Some |
3 |
C1-38-14 |
8.52 |
-0 |
1202 |
1077 |
None |
2 |
Cl-38-6 |
9.89 |
-0 |
682 |
839 |
None |
1 |
Cl-20-1 |
10.04 |
-0 |
1493 |
645 |
None |
3 |
C1-20-5 |
11.48 |
-0 |
1056 |
647 |
None |
3 |
C1-20-10 |
9.28 |
-0 |
2095 |
693 |
A few |
3 |
* 1 is the least, and 5 is the most damage.