книги / FISMA and the risk management framework the new practice of federal cyber security
..pdf188 |
Scratchinf? of materials and applications |
the free surface on the ridges of the scratch groove, the hydrostatic pressure decreases to near zero and, thus, fracture occurs easily. It has been found that, during single ploughing and repeated unidirectional ploughing on both ductile materials and many nominally brittle materials, almost all of the debris that is removed from the surface is detached from the side and frontal ridges of the scratch groove [4]. The microstructural mechanisms of the debris formation are mainly growth of voids in metallic materials and coalescence of micro "wing cracks" in ceramic materials [5]. Both mechanisms essentially involve micro-fracture driven by shear. The contact geometry to cause such micro-fracture and the extent of the micro-fracture vary from material to material.
There is no complete mechanical solution for calculating the plastic strain induced by a scratch indenter [6]. However, the plastic shear strain associated with the ploughing by a pyramidal indenter can be estimated by an approach based on the upper bound theorem in plasticity. The upper bound model has been described more fully elsewhere [7,8], so only a brief description is given here. When a rigid pyramidal indenter moves across a flat surface with an edge leading, all of the displaced material on the surface appears as ploughed ridges. Figure 2 shows the idealized arrangement of the deformation in the symmetric situation (D is the pyramid apex and CDFE is the central plane of the symmetric deforming zone), which allows us to consider only one side of the indenter. The deformation is deemed to be due to successive shear taking place on a series of subsurface shear planes FBE, FBC, BDC, BDF and BAD. The exact positions of A, B, C, E and Fare found by minimizing the rate of energy expended at (a) the shear which takes place at the shear planes, and (b) the friction which takes place at the indenter-specimen interface. Provided that the shear flow stress, k, of the material is given by the plastic stressstrain relation
(I)
nonnalload
indenter
Fig. 2. General arrangement of subsurface tangential velocity discontinuities in the upper bound model.

Evaluating the cohesive strength of a suiface material by controlled scratching |
189 |
where r is the shear strain, and Ko and n are material constants, the total plastic shear strain associated with the ploughing, together with the positions of A, B, C, E and F, is determined by minimizing the rate of expended energy.
An exact calculation of this total plastic shear strain is complicated since only a numerical solution can be obtained, and the strain hardening exponent of a specimen material, n, needs to be known. However, an approximation can be made as follows. In static indentation with a spherical tipped asperity, the plastic strain is approximately equal to 0.2 air, where a is the contact radius and r is the asperity radius [9]. In scratching, the plastic strain is much larger due to material flow around the indenter. Nevertheless, it is reasonable to expect that the strain would still be proportional to air. It is known that plastic strains caused by a pyramidal indenter, or a conical indenter that displaces the same volume at the same penetration depth, are close, as are the strains caused by conical and spherical indenters which have the same angle at the edge of contact with the ploughed surface, [1 0]. Hence, a spherical indenter can be converted into a pyramidal indenter to calculate the plastic strain produced when scratching a surface, and vice versa. Using this conversion, the shear strains of two materials with different strain hardening exponents calculated from the upper bound model and the value of air, are compared, Fig. 3. This figure shows that the shear strain remains reasonably close to air values since the strain hardening exponent of most engineering materials, including metallic and ceramic materials, is between 0.05 and 0.2.
0.6 , ------------- r ------- . , |
|
||||
~ |
|
|
|
~.=air |
|
0 |
|
|
|
|
|
.., |
|
|
|
|
|
:E |
|
|
|
|
|
c |
|
11 |
=0.05 |
|
|
" |
|
|
|
|
|
0 |
|
|
|
|
|
Ill 0.4 |
|
|
|
|
|
l |
|
|
|
|
|
::> |
|
|
|
|
|
E |
|
|
|
|
|
£ |
|
|
|
|
|
-;. |
|
|
|
|
|
~ 0.2 |
|
|
|
|
|
"i! |
|
" =0.2 |
|
|
|
tii |
|
|
|
|
|
0 |
|
|
|
|
|
0.2 |
0.-l |
0.6 |
|||
|
|
|
air |
|
|
Fig. 3. Comparison between the shear stain calculated from the upper bound approach and from air.
Based on this comparison, it is not unreasonable to use air as a measurement of the indenter induced plastic strain. Therefore, if an increasing plastic deformation results from scratching a spherical tipped indenter on a specimen surface at progressively increasing normal load, and the induced micro-fracture initiation can be detected, the corresponding value of air can be obtained and used for determining the critical plastic strain to initiate micro-fracture. More analyses of the single scratching can be found in [11].

190 |
Scratching of materials and applications |
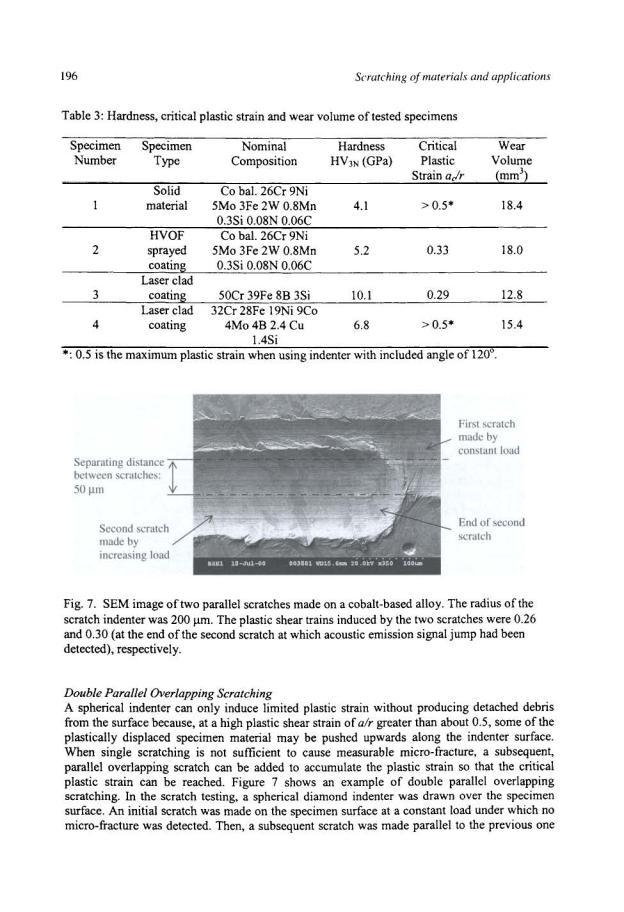
Parallel Overlapping Scratching
For materials with good ductility, the plastic strain induced by a single scratch may not be sufficient to cause measurable micro-fracture. In this case, parallel overlapping scratching can be used to accumulate the plastic strain, thereby inducing a significant amount of micro-fracture that can readily be measured. Repeated parallel overlapping scratching has been used by the authors for evaluating the cohesive strength of thick coatings or surface materials. As shown in Fig. 4, five or more parallel scratches are made on the finely polished top surface of a specimen by a spherical tipped indenter with a fixed separation distance between adjacent scratches. At light load the scratch groove is narrow and the extent of plastic deformation (proportional to the ratio of groove width to indenter tip radius as mentioned in the previous section) is small. With increasing normal load along each scratch, the scratch groove becomes wider. This results in an increase in the ratio of groove width to indenter tip radius, but also in the extent of interaction between scratches so that subsequent scratches are made on an already plastically deformed and damaged surface. Hence, although the extent of plastic deformation and damage may be small after the first scratch on the virgin surface, it becomes much more severe after the five parallel scratches. The extent of this surface damage on the specimen surface can then be used as a measure of the surface material's cohesive strength, or resistance to micro-fracture.
|
|
|
Separating distance |
|||||||
Sep ar aling distance |
|
Scratch |
between adjacent scratches |
|||||||
p |
1 |
|
|
|||||||
between adjacent scratches |
|
|
|
|||||||
|
|
|
I |
|
|
|
|
|
|
iscratch |
|
|
|
|
|
|
|
|
|
|
|
|
|
|
|
|
|
|
||||
|
|
|
|
|
|
|
|
|
|
Idirection |
|
|
|
|
|
|
|
|
|
|
|
Last
scratch
Substrate
Top view
Fig. 4. Schematic illustration showing parallel (interacting) scratching at increasing load to induce repeated and increasing plastic deformation.
APPLICATIONS
Single Scratching
As mentioned in the previous section, it is reasonable to use air as a measurement of the indenter induced plastic shear strain in single scratching. Therefore, if an increasing plastic deformation results from drawing a spherical tipped indenter across a specimen surface at progressively increasing normal load, and the onset of the induced micro-fracture can be detected, the corresponding value of air can be obtained and used for determining the critical plastic strain to initiate micro-fracture. Some examples of such application are given below.

192 |
|
|
|
Scratching of materials and applications |
|
0.3 . ··------ |
·-· |
- -· -·- -- |
. - -·---- |
·· -·--··--·---- |
0.4 |
Al20y'13%Ti02 coating
c::
0
~0.2
Jl::
0
E
Cl>
u
~01
0
0
|
20 |
|
|
|
|
30 |
|
|
|
40 |
|
|
50 |
|
||
|
|
|
|
|
|
|
Load,N |
|
|
|
|
|
|
|
|
|
|
|
|
|
|
|
|
|
(a) |
|
|
|
|
|
|
|
|
|
0.4 |
|
|
|
|
|
|
|
|
|
|
|
|
|
0.5 |
|
|
|
|
|
Ni-W-Cr-Si-Fe-B-C |
|
|
|
|
|
|
|
|||||
|
|
|
|
|
|
|
|
|
|
|
|
|
||||
|
|
|
|
|
|
|
|
|
|
|
|
|
|
|
|
~ |
c:: |
0.3 |
|
|
|
|
|
|
|
|
|
|
|
|
|
0.4 |
"' |
0 |
|
|
|
|
|
|
|
|
|
|
|
|
|
|
~ |
|
~ |
|
|
|
|
|
|
|
|
|
|
|
|
|
|
|
~ |
if |
|
|
|
|
|
|
|
|
|
|
|
|
|
|
0.3 :e |
|
0 |
|
|
|
|
|
|
|
|
|
|
|
|
|
|
|
~ |
Cl> |
0.2 |
|
|
|
|
|
|
|
|
|
|
|
|
|
|
.. |
E |
|
|
|
|
|
|
|
|
|
|
|
|
|
|
'tl |
|
|
|
|
|
|
|
|
|
|
|
|
|
|
|
|||
|
|
|
|
|
|
|
|
|
|
|
|
|
|
|
||
·;:; |
|
|
|
|
|
|
|
|
|
|
|
|
|
|
02 .3 |
|
~ |
|
|
|
|
|
|
|
|
|
|
|
|
|
|
|
~ |
|
|
|
|
|
|
|
|
|
|
|
|
|
|
|
||
|
|
|
|
|
|
|
|
|
|
|
|
|
|
|
c:: |
|
0 |
0.1 |
|
|
|
|
|
|
|
|
|
|
|
|
|
|
en |
|
|
|
|
|
|
|
|
|
|
|
|
|
|
|||
0 |
|
|
|
|
|
|
|
|
|
|
|
|
|
|
0.1 |
iii |
|
|
|
|
|
|
|
|
|
|
|
|
|
|
|||
|
|
|
|
|
|
|
|
|
|
|
|
|
|
|
|
w |
|
0 |
|
|
|
AE |
|
|
|
|
|
|
|
|
|
0 |
< |
|
|
|
|
|
|
|
|
|
|
|
|
|
|
|
||
|
|
|
|
|
|
|
|
120 |
|
|
|
|
|
|||
|
|
|
|
|
|
|
|
|
|
|
|
|
||||
|
|
|
|
|
|
|
|
|
|
|
||||||
|
60 |
60 |
100 |
|
140 |
160 |
|
|||||||||
Load,N
(b)
Fig. 6. AE signal per unit load and coefficient of friction as a function of nonnalload for a 200 j.lm radius diamond indenter scratching (a) Ah03/13% Ti02 coating, and (b) Ni-W-Cr-Si-Fe-8- C coating.
j.l, (the ratio of tangential force to nonnalload) increased gradually with the nonnalload. There was no correspondence between the initiation of the micro-fracture and any increase in friction coefficient, Fig. 6. The increase in AE signal is a good indication of the initiation of microfracture, it was thus used as the main criterion to detennine the initiation of micro-fracture in the tests.
In such tests, the contact width at the position where micro-fracture initiated was measured by optical microscopy (with an uncertainty < 1 j.lm) and then the critical plastic strain to microfracture, a/r, was detennined.
Evaluating the cohesive strength of a surface material hY controlled scratching |
193 |
Scratching parameters
The single scratch tests were carried out at various sliding speeds and rates of load ramping. It was found that, although the loading speed and sliding speed have little effect on the critical groove width for micro-fracture initiation within the available tester ranges (3 to 35 mm/min. and 32 to 400 N/min., respectively), the measured data were less scattered when using lower sliding and loading speeds. A balance between the sliding speed and the rate of load increase is needed to achieve a suitable load increment per unit scratch length that allows accurate measurement of the critical groove width. Therefore, all scratch tests were carried out at the minimum loading speed of 32 N/min. Sliding speed was chosen to ensure that micro-fracture occurred about 3 to 8 mm from the beginning of the scratch, depending upon specimen size. This resulted in sliding speeds between 3 and I0 mrn/min.
Suitability ofmaterials for measurement by the scratch method
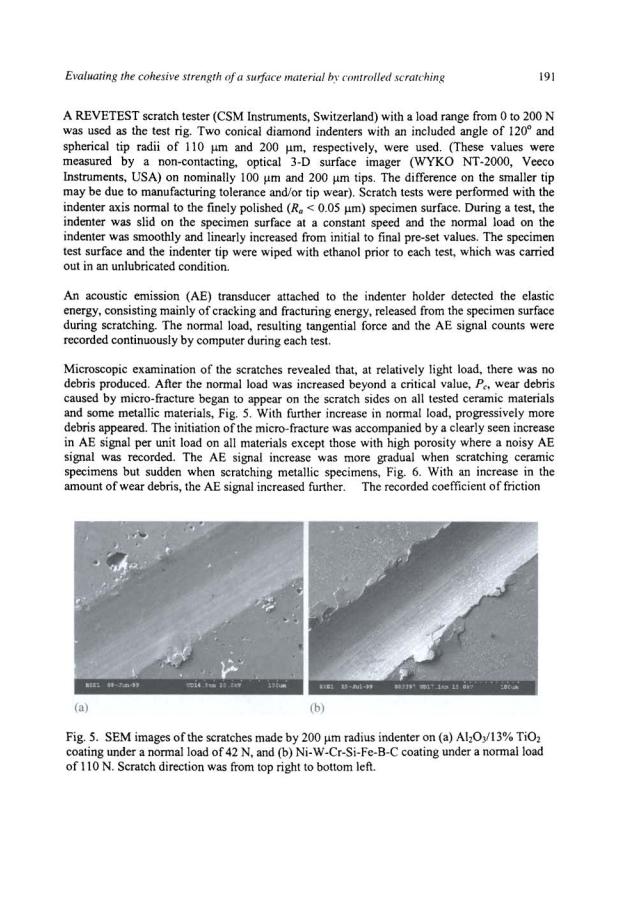
Various materials, including metallic materials and ceramic materials in both solid and coated forms, were tested. All coatings were relatively thick (> 200 !lm after grinding and polishing) and, thus, the plastic deformation zone remained entirely within the coating, as estimated based on Johnson's hemi-spherical core model of contact plasticity [10]. It was found that, on more brittle materials such as sintered alumina, magnesium oxide and quench-hardened 52100 steel, surface or subsurface macro-cracks developed before the normal load reached the critical load for micro-fracture. Recorded AE signals were too variable to allow detection of micro-fracture initiation. Wear debris adjacent to the scratches sometimes consisted of macroand microfracture sized material, which also made it difficult to determine when micro-fracture initiated. On the other hand, for materials with good ductility, including most solid metallic materials and many metallic coatings, no micro-fracture took place even when the plastic strain, air, reached the maximum value of 0.5 when using the 120° included angle indenters. For such ductile materials, parallel, overlapping scratching is needed to accumulate sufficient unidirectional plastic strain to eventually produce micro-fracture. It was also found that, for porous materials, such as thermal sprayed alumina with a porosity above 5 %, the AE signal was high and noisy, and micro-fracture initiation could not be detected using this method. In such cases, microfracture initiation was determined solely by microscopic observation after testing.
Effect oftip radius
Various ceramic and metallic coatings were scratched by the two indenters with spherical tip radii of 110 Jlm and 200 !lm. It was found that, when scratching some metallic coatings using the 110 1-1m radius indenter, a few AE signal peaks arose that did not correspond with any micro-fracture on scratch edges. It is believed that these resulted from sub-surface cracking driven by tensile stress, since the sharp indenter is capable of generating and propagating such cracks while scratching coatings containing pre-existing defects. To avoid the interference of such cracking on micro-fracture detection, the 200 !liD radius indenter was used to evaluate metallic coatings.
The effect of tip radius on the critical plastic strain to micro-fracture was studied by scratching two plasma sprayed ceramic coatings, Ab03 and Ab03/13% Ti03, because these have a unique microstructure that has been characterized previously [12] for studies of their damage mechanisms. These coatings contain a network of vertical micro-cracks and many horizontal micro-pores. This microstructure effectively deflects any single dominant macro-crack so that brittle fracture is suppressed, but it cannot withstand large plastic strain and, thus, microfracture readily takes place.

194 |
Scratching of materials and applications |
Table 1 shows the test results. The tests were carried out at a sliding speed of I0 rnmlmin. and load ramping speed of 32 N/min. These results show that the radius of the spherical tip has little effect on the critical plastic strain to micro-fracture because of the geometrical similarity in the stress-strain field as long as the contact dimension remains very much larger than the microstructure scale (e.g., splat sizes) of the coatings.
Scratch testing has demonstrated some success in the following practical uses of the method.
Evaluating the cohesive strength ofcoatings and comparison with their abrasion resistance
An alumina coating was sprayed under different processing conditions from 18 J.lm mean particle size, 99.9 % pure mono-crystalline a-alumina, onto a grit-blasted mild carbon steel substrate using an axial plasma spray torch (Axial III System, Northwest Mettech Corp., Richmond, BC, Canada). Micro hardness measurements were made on the top surfaces of the coatings using a Vickers indenter at 3 N load. Abrasive wear resistance of the coatings was evaluated in a pin-on-drum test ln this a 5 mm wide beam specimen was pressed under 12.8 N load against a 200 mm diameter drum (rotating at 0.26 m/s) that was covered with course (200 J.!m) SiC abrasive paper. Details of the effects of different processing conditions on the composition, microstructure and properties of the alumina coatings have already been reported [13,14]. Reproduced in Table 2 is a summary of relevant data on processing conditions, microhardness and abrasive wear results. The ductility of the coatings under model abrasive wear conditions, as represented by the critical plastic strain values derived from the single scratch experiments, are listed in the last column of the table.
Table 1: Critical plastic strains to micro-fracture of two ceramic coatings
|
Indenter Tip |
Critical |
Scratch Width |
Critical Plastic |
|
Material |
Radius |
Normal Load |
at Critical Load |
Strain |
|
|
r (gm) |
Pc(N) |
2ac (gm) |
a!r |
|
|
|
|
17 |
51 |
0.23 |
|
110 |
16 |
49 |
0.22 |
|
A}z03 coating |
|
|
18 |
52 |
0.24 |
|
|
|
56 |
90 |
0.23 |
|
200 |
58 |
93 |
0.23 |
|
|
|
|
59 |
96 |
0.24 |
|
I 10 |
12 |
42 |
0.19 |
|
|
|
|
14 |
44 |
0.20 |
AlzOJ/13% Ti03 |
|
|
35 |
75 |
0.19 |
coating |
200 |
33 |
73 |
0.18 |
|
|
|
|
36 |
76 |
0.19 |
|
|
|
36 |
75 |
0.19 |
Evaluating the cohesive strength of a suiface material by controlled scratching |
195 |
||||||||
Table 2: Processing conditions and test results for thermal sprayed alumina coatings |
|||||||||
|
|
|
|
|
|
|
|
||
|
|
Coating PreEaration |
|
Coating ProEerties |
|
||||
Spray |
Vol.% |
Relative |
Torch |
Relative |
Hardness |
Abrasive |
Critical |
||
Run |
H2 |
Heat Input |
Nozzle |
Residence |
HVJN |
Wear |
Plastic |
||
|
|
To Plasma |
Size |
Time In |
(GPa) |
Rate, |
Strain, a!r |
||
|
|
|
(mm) |
Plasma |
|
(g/Nm) |
|
|
|
|
10 |
Low |
12.5 |
Low |
10.7 |
0.315 |
|
|
|
I |
0.18 |
|
|||||||
2 |
10 |
Low |
14.1 |
High |
10.4 |
0.287 |
0.19 |
|
|
3 |
20 |
High |
12.5 |
Low |
10.7 |
0.231 |
0.22 |
|
|
4 |
20 |
High |
14.1 |
High |
14.5 |
0.232 |
0.21 |
|
|
Clearly, the higher critical plastic strain to micro-fracture values of the coatings from spray runs 3 and 4 correlate with their previously measured greater abrasive wear resistance. Microstructural examination revealed that the coatings from spray runs 1 and 2 contained a few incompletely melted alumina particles, and that their porosity and horizontal-to-vertical microcrack ratios were higher, all due to the lower heat input during spraying (14]. These factors resulted in better microstructural integrity of the coatings from spray runs 3 and 4. This work shows that using the relatively simple, but well-controlled, scratch test to evaluate the plastic strain to micro-fracture can provide a similar relative ranking of the cohesive strength of the coatings.
Screening candidate materials for wear application
Several metallic materials, candidates for potential erosion-resistant applications, have been evaluated by microhardness, controlled scratching and slurry erosive wear tests. The latter test has been described in detail previously [15]. In essence, a 5 mm diameter jet of concentrated slurry of crushed alumina (200 Jlm mean size) in tap water was directed at 15 m/s against specimen surfaces under 90° nominal impingement angle for 1 hour. The specimens and the test results are given in Table 3. Although the high velocity oxyfuel (HVOF) sprayed Co/Cr based alloy is about 25 % harder than the bulk material of identical composition, their slurry erosion wear rates are almost identical since the bulk material has better cohesive strength (as revealed by their critical plastic strain values) than the coating. On the other hand, identical processing of different alloy compositions produced material specimen 3 approximately 50 % harder than specimen 4 but it had much lower cohesive strength (according to the critical plastic strains) and, hence, it was only about 20 % more wear resistant. These results indicate that, along with hardness, the critical plastic strain to microfracture is another important material property that can be used as a guide to the relative abrasive and erosive wear resistance of materials.