

книги / FISMA and the risk management framework the new practice of federal cyber security
..pdfCharacterization of mar/scratch resistance of coatings |
177 |
such as shown in Fig. 9. The curve is very useful. If it is heavily weighted in the light side, it indicates material in the applications will mostly suffer from light invading forces, having only narrow and shallow mars at its surface, i.e. marring will dominate; it will not be necessary to enhance its resistance against the severe damages. On the other hand, if the force curve is heavily weighted in the heavy side, it indicates material will mostly suffer from severe damages, i.e. cracking, delamination, and chipping; it will make no sense to concentrate on improving its micro mar resistance. For a new sample, carrying out a test in the lab to measure its critical forces for different damages, the weights of each damage mode that will occur on the surface of the sample, if it is used in the real field, can be predicted by using the curve. Suppose the critical forces of the new sample for rough trough, for cracking, for delamination, and for chipping are measured to be Ft, F2, F3, and F4, respectively. The area under the curve between 0 and Ft is the occurrence weight of mars, the area under the curve between F1 and F2 is the occurrence weight of rough trough, and so forth, as shown in Fig. 10, which avoids a time-consuming field test. The larger the critical forces, the more light damages the material will experience.
P(F)
Wmar
Fig. 10. Prediction of the weights of different damages that will occur in the application for a sample, whose measured critical forces for rough trough, cracking, delamination, and chipping are F1, Fz, FJ, and F4, respectively, in the laboratory test.
Quantification of damages depends on the requirements in the applications. For the development of a material used for windows, considering that an object will be clearly sharp if viewed through an undamaged window and will be milky or cloudy if viewed through a damaged window, using the haze level increase measurement to quantify the different damage modes is adequate. On the other hand, if it is the development of new topcoat applied to the automobile bodies, using an optical reflection measurement will be adequate.
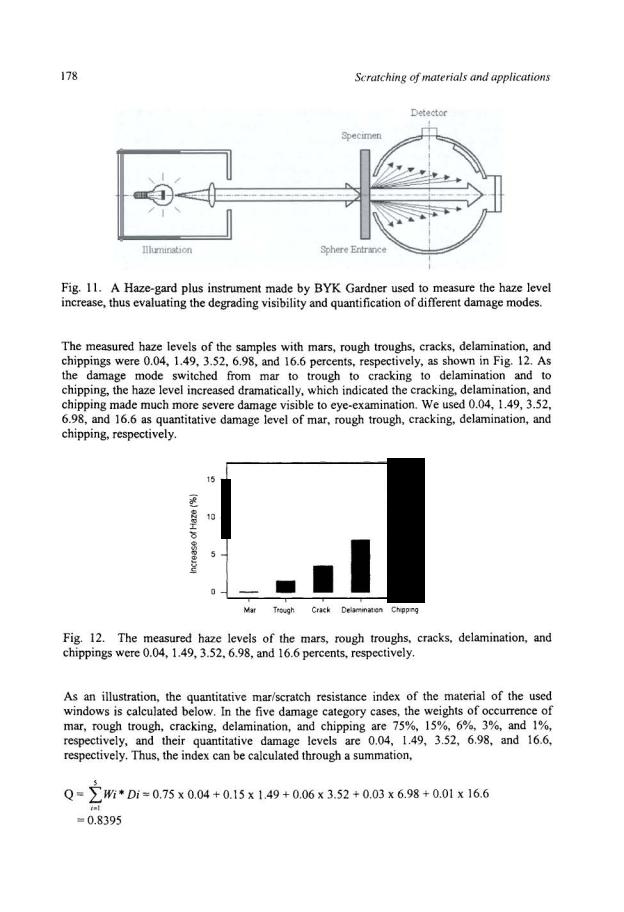
A Haze-gard plus instrument made by BYK Gardner, as shown in Fig. 11, was used to evaluate the degrading visibility of different damage modes by measuring the haze level increase. In the measurement, the transparent specimen is illuminated at normal incidence, and the transmitted light is measured photo-electrically by an integrating sphere. Haze is caused by wide-angle scattering. According to ASTM D 1003, haze is the percentage oftransmitted light that deviates from the incident beam by more than 2.5° on the average. When the total transmittance is measured, the sphere's normal outlet is closed, and when haze is measured, the normal outlet is opened. Increase of haze of a transparent sample reduces the contrast of an object viewed through the transparent sample and results in a milky or cloudy appearance of the object.
180 |
Scratching of materials and applications |
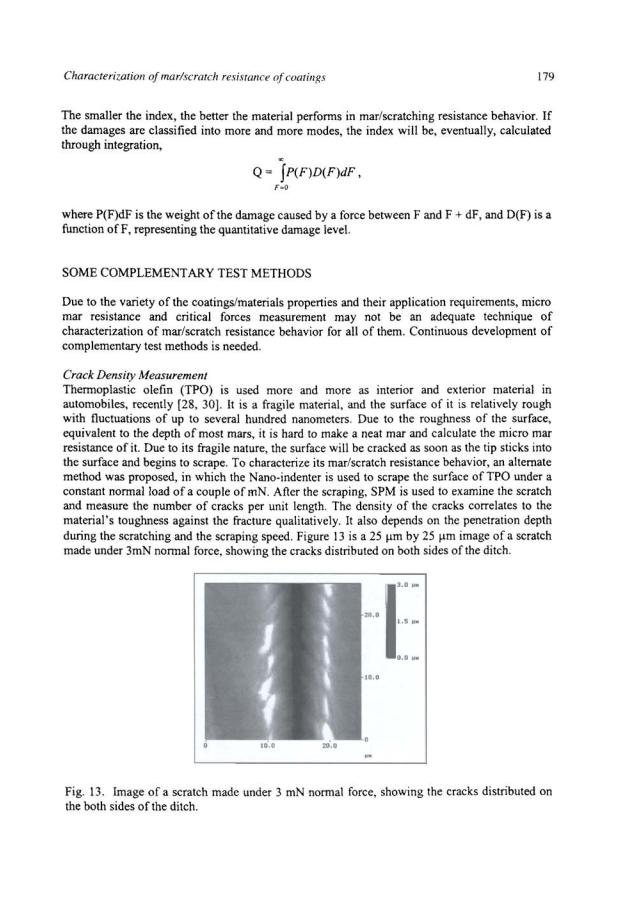
More than one dozen TPO samples with various components, prepared with different processing procedures, were examined. The density of cracks, the average value from about a dozen images examined for each sample, varies from about 8 cracks per 25 f!m to about 16 cracks per 25 flm. Usually, the less the crack density, the stronger the toughness against the fracture.
Repeated Scraping Test
For the materials that may be subjected to the repeated scraping along the same trench in the applications, this test can provide a good measurement of their mar/scratch resistance behavior in the applications. For example, the glazing material used for automobile side windows, the hard dust particles trapped between the window and the rubber seals may repeatedly mar and scratch the surface in the same trench when the window is rolled up and down.
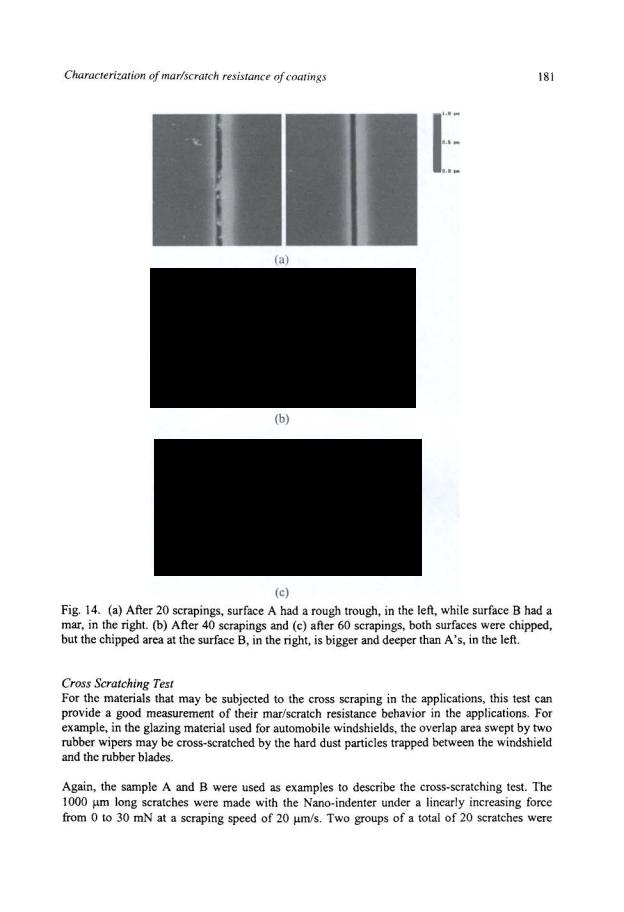
In the repeated scraping test, the Nano-indenter is used to scrape the sample surface along the same trench with a relatively small and constant load for several selected times. After the scrapings, the images of the scratches are taken using the SPM for configuration study, and the depths of the scratches are measured. The test results of two glazing materials, labeled as A and B, potential candidates for windows, are presented as examples. In the test, their surfaces were scraped along the same trench under a constant load of 5mN, repeatedly for 5, 10, 20, 40 and 60 times at a scraping speed of 20 f!rnls. The measured depths of the mars after 5 and 10 scrapings at the surface of A were 60 and 90 nm, respectively; the measured depths of the mars after 5, 10, and 20 scrapings at the surface of B were 100, 125, and 135 nm, respectively, before the damages switched to the rough trough. The depths of mars at the surface of A were shallower than those at the surface of B after the same number of scrapings, which might be an indication that sample A is harder than B at the top layer. It was confirmed by the micro indentation hardness test that A, under a light normal force of 1.5 or 3.0 mN, was harder than B by about 35%.
The images of the scratches showed that the damages of sample A belonged to the category of "mar" after 5 or 10 scrapings, became "rough trough" after 20 scrapings, and the chipping took place after 40 or 60 scrapings. In contrast, the damages of B stayed in the category of "mar" beyond 20 scrapings. However, when the chipping occurred after 40 and 60 scrapings, the damages at the surface of B were more severe than those at the surface of A; the chipped spots were deeper and wider. The selected images for illustration are shown in Fig. 14. The results indicate while B is soft, it is more ductile, so it stayed in "mar" longer. On the other side, sample A is hard, but it may be brittle and was vulnerable under the increasing load, and it switched to rough trough earlier. The results are consistent with the results of the micro mar resistance and critical force measurements of A and B. Under the light loads, MMR of sample A is better than B, since B is soft and ductile, and the mars in the surface of B were deeper and wider. However, the critical force of switching from mar to rough trough of sample A was lower than B's, since A is brittle, and its surface is easily broken under the increasing load.
Examining the dimensions of the chippings further suggest that the vulnerable layer of sample A, where the adhesion/cohesion was weak and it was easy to be chipped off, might be in the depth of 600-800 nm, while B's might be in the depth of 1.4-1.8 f!m. When the chipping took place in both surfaces, B suffered more severe damages than A; see the scratch images after 40 and 60 scrapings in Fig. 14.

182 |
Scratching of materials and applications |
made in a pair of orthogonal directions, which made a matrix with a spacing of 100 1..1m as shown in Fig. 15. After the scratching, all the intersections were examined by the SPM, and a mark "x" was used to indicate the observation of the chipping at the intersections.
|
|
|
' |
. ~- |
|
|
|
|
|
|
.. |
|
|
|
)( |
|
|
|
|
|
|
|
|
|
|
|
|
|
|
|
|
|||||
|
|
' |
|
|
|
|
|
|
" |
|
" |
|
|
¥ |
|
" |
|
.,..... |
|
' |
|
|
|
|
|
|
|
|
" |
" |
""" |
|||||
|
|
|
|
|
|
|
|
|
|
|
|
|
|
|
|
|
|
|
|
|
|
|
|
|
||||||||||||
...."' |
|
|
! |
|
|
|
|
|
|
|
|
|
|
|
I |
|
|
|
...." |
|
|
|
|
|
|
|
|
|
• . ~ |
|
t |
|||||
|
|
|
|
|
|
|
|
|
|
|
|
|
|
|
|
|
|
|
|
|
|
|
|
|
|
|
|
|||||||||
|
|
|
|
|
|
|
|
|
|
|
|
|
|
|
|
|
|
|
|
|
|
|
|
|
|
|
|
~ |
~( |
|
|
|||||
|
|
""'"' |
|
|
····•······ |
|
|
|
|
|
t! |
--)( |
|
|
|
|
|
++ |
. )( |
|
~I |
).; |
)( |
|
t |
|||||||||||
|
|
|
|
|
|
|
|
|
|
|
|
|
||||||||||||||||||||||||
|
|
|
|
|
|
|
|
|
|
|
|
|
|
|
|
l |
|
|
|
|
|
|
|
|
|
i |
)( |
)( |
|
i |
|
X |
|
r |
||
|
|
|
|
' |
|
|
|
|
|
|
|
|
|
r X |
|
|
|
|
|
|
f---- |
|
|
"' |
|
|
||||||||||
|
|
|
|
' )( |
|
|
|
|
|
|
|
|
|
|
|
|
|
|
|
|
|
|
|
|||||||||||||
|
|
|
|
|
|
|
|
|
|
|
|
|
|
|
|
|
|
|
|
|
|
|
|
|
||||||||||||
|
|
|
|
|
|
|
|
|
|
|
|
|
|
|
|
|
|
|
|
|
|
|
t |
|||||||||||||
|
|
|
|
|
|
|
|
|
|
|
|
|
|
* |
|
+ |
)( |
|
|
|
|
I |
|
jI |
"' |
"' |
|
t |
• |
)( |
|
|||||
|
|
|
|
|
|
|
|
|
|
|
|
|
|
|
|
|
|
|
|
|
|
|||||||||||||||
|
|
|
|
|
|
|
|
|
|
|
|
|
|
+- |
<--• |
--+--" |
|
|
|
|
I |
|
: I |
|
|
|
t |
|
|
|
|
|
||||
|
|
|
l |
|
|
|
|
|
|
|
|
|
|
~ |
|
r )( |
|
|
- -t- -j---r-- |
. ---+·------ |
|
|
|
|||||||||||||
|
I |
|
: |
|
|
|
|
|
|
|
|
: |
|
|
|
|
|
|
|
|
|
|
i |
' |
|
|
|
|
|
|
|
|
|
|||
|
|
|
|
|
|
|
|
|
|
|
|
|
|
|
|
|
|
|
|
|
|
|
|
|
|
|
|
|
||||||||
'I· |
|
|
|
|
|
|
|
|
|
|
|
|
|
|
|
|
|
|
|
|
|
|
r |
.-+ |
|
|
|
|
|
|
|
|
|
|||
|
i |
|
|
|
|
|
|
|
|
|
|
|
|
|
|
|
|
|
|
|
|
|
|
__ l |
|
. :___ L |
|
|
|
|
|
|
|
|
|
|
|
|
' Sample A |
|
|
|
|
|
|
|
|
|
|
|
|
|
|
|
|
|
|
|
|
||||||||||||||
|
|
|
|
|
|
|
|
|
|
|
|
|
|
|
|
Sample B |
|
|
|
|
|
|
||||||||||||||
Fig. 15. Two groups of a total of 20 scratches, each of them waslOOO 1..1m long made under a linearly increasing force from 0 to 30 mN, in a pair of orthogonal directions, made a matrix with a spacing of 100 j..lm. A mark "x" was used to indicate the observation of the chipping at the intersections.
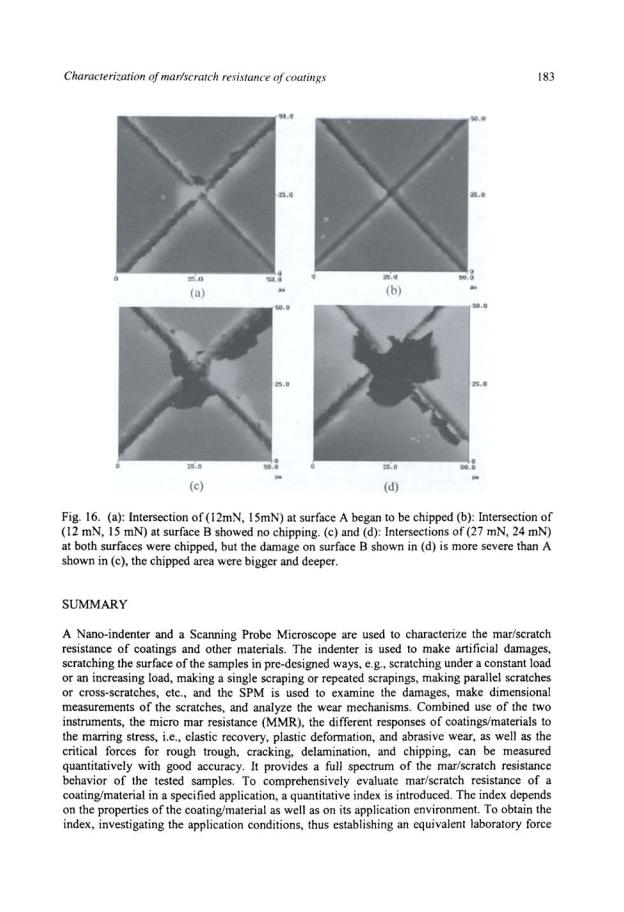
There were more chipped intersections in the surface of A than that in the surface of B. The chipping began to take place under the lighter loads in surface A than that in surface B. However, as soon as the chipping began to take place at the intersections of surface B, the damage was more severe than that of surface A. Figure 16 shows two pairs of images. One was taken at the intersection of (12 mN, 15 mN), where the chipping took place only in the surface of A; the other was taken at the intersection of (27 mN, 24 mN), where the chippings occurred in both surfaces, and the chipped spot in the surface of B was bigger and deeper. The results gave further support to the repeated scraping test. Due to the brittleness of the top layer of sample A and ductility of sample B, the intersections in the surface of A began to be chipped first. Under the increasing loads, chipping took place at the intersections of surface B, too. The vulnerable layer of B is deeper, thus the chipped pieces in the surface of B are thicker and bigger than A's.
The Taber test is commonly used in the industries. In the test, the abrasion is produced by the contact of a test sample, turning on a vertical axis, with the sliding rotation of two abrading wheels, which results in an abraded ring-shaped area formed by crossed scratches. Most severe damages occur at the intersections of the crossed scratches [42]. The cross-scratching test with the Nano-indenter and SPM could be useful in detailed analyzing of the results of Taber test.
184 |
Scratching of materials and applications |
distribution curve is a necessary first step, followed by quantification of the different damage modes. Then, the index can be formed either through summation or integration. To meet the variety of coatings/materials properties and the requirements in their applications, some complementary test methods, such as the crack density measurement, repeated scratching test, and cross-scratching test are discussed.
ACKNOWLEDGEMENTS
This work is supported by the National Science Foundation Industry/University Cooperative Research Center in Coatings at Eastern Michigan University (NSF IIU CRCC at EMU) and the Graduate School of EMU.
The authors are grateful to Dr. Frank Jones, the long-time collaborator in coatings research, and Dr. Rose Ryntz and Dr. Alex Scholten for their helpful discussions in developing and improving the techniques.
REFERENCES
1.Gregorovich, B.V. and McGonigal, P.J. (1992) ?roc. Adv. Coat. Techno/. Conf ASMIESD, Materials Park OH, 121.
2.Kahl, L., Halpaap, R. and Wamprecht, C. (1993) Surf Coat. Int. I JOCCA 76(10), 394.
3.McGinniss, V.D. (1994) Paint & Coat. Ind. 34.
4.Courter, J.L. (1997) Journal of Coatings Technology 69(866), 56.
5.Andrei, D.C., Keddie, J.L., Hay, J.N., Yeates, S.G., Briscoe, B.J. and Parsonage, D. (2001) Journal of Coatings Technology 73(912), 65.
6.Schulz, U., Wachtendorf, V., Klimmasch, T. and Alers, P. (2001) Progress in Organic Coatings 42 (1-2), 38.
7.Bertrand-Lambotte, P., Loubet, J.L., Verpy, C. and Pavan, S. (2002) Thin Solid Films 420,281.
8.Ryntz, R.A. and Britz, D. (2002) Journal ofCoatings Technology 74(925), 77.
9.Briscoe, B.J., Pelillo, E. and Sinha, S.K. (1997) The lOth International Conference on Deformation Yield and Fracture of Polymers, Churchill College, Cambridge, UK.
10.Wagner, G. and Osterhold, M. (1999) MATERIALWISSENSCHAFT UND WERKSTOFFTECHNIK 30( 10), 617.
11.Lin, L., Blackman, G.S. and Matheson, R.R. (2000) Progress in Organic Coatings 40(1-
4), 85.
12.Bertrand-Lambotte, P., Loubet, J.L., Verpy, C. and Pavan, S. (2001) Thin Solid Films 398,306.
13.Osterhold, M. and Wagner, G. (2002) Progress in Organic Coatings 45(4), 365.
14.Krupicka, A., Johansson, M. and Hult, A. (2003) Progress in Organic Coatings 46(1), 32.
15.Schlesing, W., Buhk, M. and Osterhold, M. (2004) Progress in Organic Coatings 49(3), 197.
16.Tahrnassebi, N. and Moradian, S. (2004) Polymer Degradation and Stability 83(3), 405.
17.Everson, M.P., Gangopadhyay, A.K., Jaklevic, R.C., Scholl, D. and Shen, W. (1994)
NANO Advanced Study Institute.
18.Slough, C.G., Everson, M.P., Jaklevic, R.C., Melotik, D.J. and Shen, W. (1996)
Tribology Transactions 39(3), 609.
Characterization of mar/scratch resistance of coatings |
185 |
19.Shen, W., Ji, C., Jones, F., Everson, M.P. and Ryntz, R.A. (1996) Polym. Mater. Sci. Eng. 74,346.
20.Shen, W., Ji, C., Jones, F., Everson, M.P. and Ryntz, R.A. (1996) Surface Coatings International79(6), 253.
21.See contact mode Nanotips of Digital Instruments, Veeco Metrology, Group.
22.Shen, W., Smith, S.M., Jones, F.N., Ji, C., Ryntz, R.A. and Everson, M.P. (1997)
Journal ofCoatings Technology 69(873), 123.
23.For example, Imetra, Inc. in Elmsford NY, it supplies the diamond tips with various shapes and sharpness, whose manufacturer is in Switzerland
24.Shen, W. and Jones, F.N. (1999) In: Microstructure and Microtribology of Polymer Surface: Investigation of Tribological Properties of Polymeric Surface Coatings with Scanning Probe Microscope, pp. 439-454, Tsukruk, V.V. and Wahl, K.J. (Eds) The
American Chemical Society.
25. Shen, W.C., Jiang, B. and Jones, F.N. (2000) Journal of Coatings Technology 72(907), 89.
26.For example, Nano-Indenter XP made by MTS, Nano Scratch Tester by CSEM, TriboScope by Hysitron, etc.
27.Shen, W., Sun, J., Liu, Zh., Mao, W., Nordstrom, J.D., Ziemer, P.O. and Jones, F.N. (2004) Journal of Coatings Technology Research 1(2), 117.
28.Ryntz, R.A., Abell, B.D., Pollano, G.M., Nguyen, L.H. and Shen, W. (2000) Journal of Coatings Technology 72(904), 47.
29.Hara, Y., Mori, T. and Fujitani, T. (2000) Progress in Organic Coatings 40(1-4), 39.
30.Yaneff, P.V., Adamsons, K., Ryntz, R.A. and Britz, D. (2002) Journal of Coatings Technology 74(933), 135.
31.Betz, P. and Bartelt, A. (1993) Progress in Organic Coatings 22, 27.
32.Sano, S., Yamada, K. and Ishihara, M. (1994) Toso Kagaku 29,475.
33.Shen, W., Smith, S.M., Ye, H., Jones, F. and Jacobs, P.B. (1998) Tribology Letters 5(1), 75.
34.Shen, W., Ye, H. and Jones, F. (1998) Tribology Letters 5(2), 197.
35.Bull, S.J., Rickerby, D.S., Matthews, A., Leyland, A., Pace, A.R. and Valli, J. (1988)
Surface and Coatings Technology 36, 503.
36.Bull, S.J. (1997) Tribology International 30(7), 491.
37.Ronkainen, H., Kosinen, J., Vaxjus, S. and Holmberg, K. (1999) Tribology Letters 6, 63.
38.Shen, W., Jiang, B., Gasworth, S.M. and Mukamal, H. (2001) Tribology International 34(2), 135.
39.Lin, L., Blackman, G.S. and Matheson, R.R. ( 1999) In: Microstructure and Microtribology of Polymer Surface: Micromechanical Characterization of Scratch and Mar Behavior of Automotive Topcoats, pp. 428-438, Tsukruk, V.V. and Wahl, K.J. (Eds) The American Chemical Society.
40.Courter, J.L. and Kamenetzky, E.A. (1999) The 5th Nurnberg Congress: "Creative Advances in Coating Technology", Nurnberg, Germany.
41.Shen, W., Jiang, B., Scholten, A., Schwenke, R., Mi, L., Seal, C. and Wang, P. (2004)
Tribology Letters 17(3), 637.
42.Sun, J., Mukamal, H., Liu, Zh. and Shen, W. (2002) Tribolo~ Letters 13(1 ), 49.
186
CHAPTER9
EVALUATING THE COHESIVE STRENGTH OF A SURFACE MATERIAL BY
CONTROLLED SCRATCHING
YONGSONG XIE and HOWARD M. HAWTHORNE
Institute for Fuel Cell Innovation, National Research Council Canada,3250 East Mall, Vancouver, BC V6T JW5, Canada. Email: Yongsong.Xie@nrc-cnrc.gc.ca
ABSTRACT
Controlled scratching is a convenient technique for evaluating the cohesive strength of a coating or surface material. Single or parallel overlapping scratching by a hard spherical indenter under increasing load induces increasing contact deformation (strain) in a controlled manner. Thus, plastic deformation is accumulated incrementally, and micro-fracture is induced, on the specimen surface. Cohesion criteria based on the extent of acoustic emission, micro-fracture and tensile cracking in the scratch groove, as well as the scratch groove area, are described and results are presented that correlate reasonably well with the wear characteristics of a number of different materials.
KEYWORDS
Single scratch, parallel overlapping scratch, cohesive strength, microstructural integrity, microfracture, critical plastic strain.
INTRODUCTION
The use of a harder material to scratch a softer one dates back at least 7000 years [ 1] and possibly even to pre-historic times, as evidenced by the examples of rock or cave carvings in many parts of the world. However, it is only much more recently that scratch testing is used systematically to provide some measure of the "strength" of a solid material. Scratch testing has been used for measuring the hardness of a surface, assessing the adhesion between a coating and the substrate, simulating abrasive wear, etc [2]. In addition, scratch testing can be used for evaluating the cohesive strength of a coating or surface material. The term cohesive strength is used here to indicate the microstructural integrity, or resistance to micro-fracture under deformation, of a surface material. A material's cohesive strength depends upon many factors such as, the bonding between different phases in a composite material, inter-splat bonding in thermal sprayed coatings, inter-crystallite boundaries in PVD coatings, and microcracks or other weakening imperfections or defects within different materials. It is this material characteristic that we investigate below via controlled scratching techniques as distinct from the study of coating - substrate adhesion that is the more usual province of scratch testing.