

книги / FISMA and the risk management framework the new practice of federal cyber security
..pdf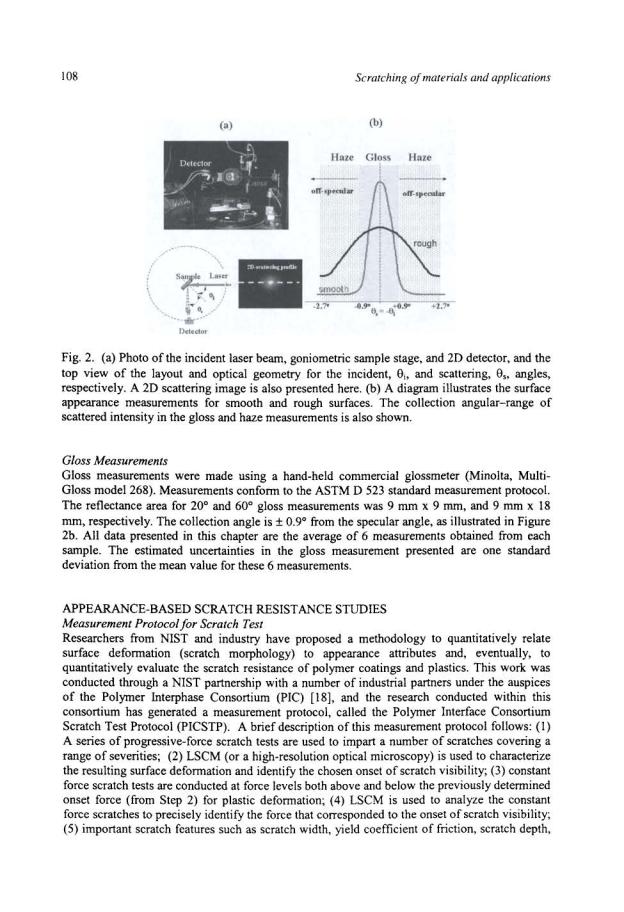

110 |
Scratching of materials and applications |
Figure 4 shows the scratch penetration data generated by the instrument during progressiveforce scratch tests on PMMA. Variations in the penetration profiles resulted from "stick-slip" behavior corresponding to the formation of the cracking pattern that had been previously identified through optical inspection. The corresponding residual depth and scratch width that signal the onset of cracking were estimated to be (500 ± 20) nm and (6 ± 1) ~m. respectively. At the onset point, the elastic recovery was determined to be 56 %.
Residual Depth
0 |
|
e |
I |
.s -1000 |
I/' |
"'Cl> |
i ' |
~-2000
:::1
u
c: |
-3000 |
|
|
|
|
|
|
|
~ |
|
|
|
|
|
|
|
|
f |
|
|
|
|
|
|
|
|
Gi |
-4000 |
|
|
Scratch Depth '-- |
|
|
|
|
c: |
|
|
|
|
|
|
|
|
Cl> |
|
|
|
|
|
|
|
|
11. |
|
|
|
|
|
|
|
|
|
-5000 |
|
|
|
|
|
|
|
|
|
|
|
|
|
|
|
|
|
0 |
100 |
200 |
300 |
400 |
500 |
||
Scratch Distance (11m)
Fig. 4. Plot of penetration data recorded by the indentation instrument during the progressiveforce scratch tests described in Figure 3 for PMMA. The lower curve represents the penetration depth during the scratch, whereas the upper curve represents the unrecovered depth (residual depth) remaining just after scratching. The estimated uncertainty is one standard deviation (k=1) in the data, which is about 3 %.
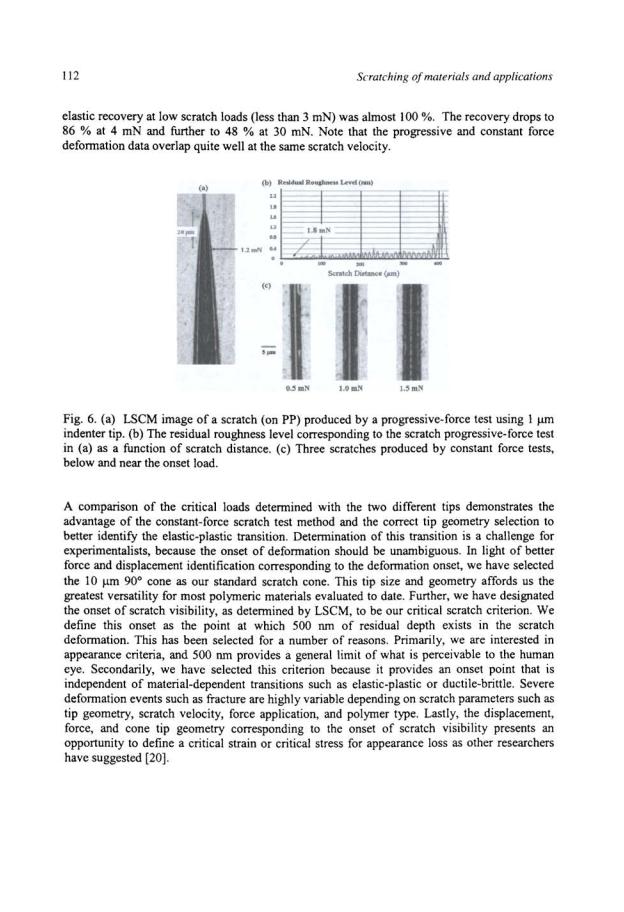
Scratch velocity is known to be a critical parameter in the creation of scratch surface damage (depth, width, and the onset force). Figure Sa shows the scratch damage obtained with a conical indenter at a constant 4 mN of normal force but at different scratch velocities. The measured scratch width was approximately 30 % wider at 1 ~m/s than it was at 100 ~m/s. The velocity dependence of scratch deformation demonstrates how the viscoelastic properties of a polymer influence scratch resistance. At the high velocities, the material is stiffer, and, thus, resulting plastic deformation is Jess. Similar trends were observed in the scratch and residual depth measurements when varying scratch velocities under different constant-force values. Figure 5b and 5c show the semi-log plot of scratch/residual depth and scratch width as a function of scratch velocity, respectively. The residual depth decreased from ""' 570 nm at 1 ~m/s to ""' 400 nm at 100 ~m/s, and the elastic recovery changed from 56 % at 1 ~m/s to 63 % at 100 ~m/s, for a constant scratch force of 4 mN. In both plots, a linear relationship (inversely correlated) was observed in the semi-log plot, i.e. depth (or width) oc log (velocity). The complex interplay between polymer viscoelasticity and the velocity dependence of scratch resistance illustrated the challenge in comparing scratch rankings when the scratch velocity is not constant between laboratories. Scratch rankings can be further convoluted when different tip geometries or an onset of deformation (cracking) is used to compare dissimilar materials. These issues are explored on the model PP materials in the next section.
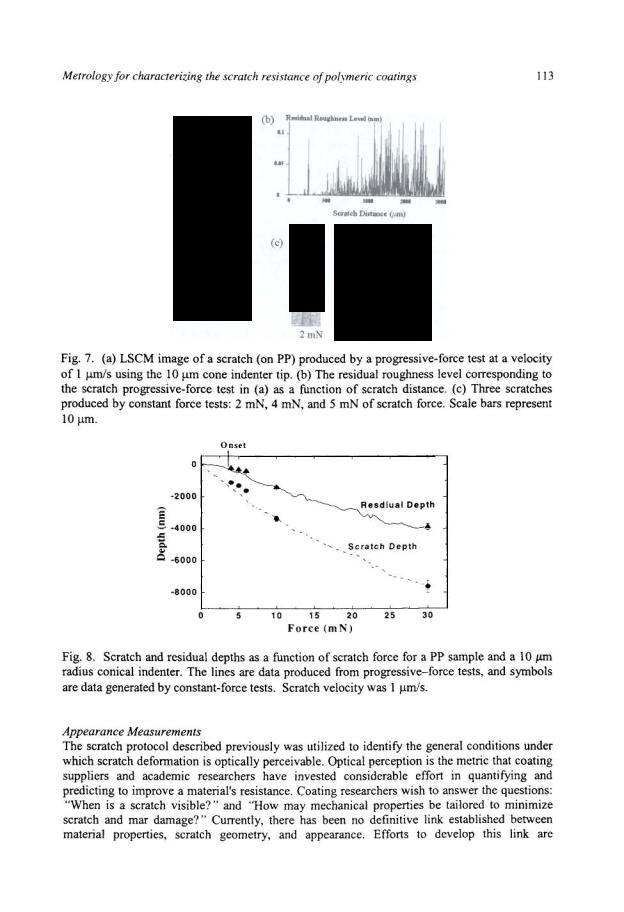

Metrology for characterizing the scratch resistance of polvmeric coatings |
115 |
|||||||
|
300000 |
|
|
|
|
|
|
|
!! |
250000 |
|
|
|
~ |
0 |
EP15 |
|
c: |
|
|
|
|
'Y,.. |
" |
EP45 |
|
0 |
|
|
... ... |
|
|
|
||
" |
|
|
... ... |
|
|
|
||
.!!. |
200000 |
|
|
|
|
|||
-.,~ |
150000 |
|
... |
... |
|
|
|
|
! |
|
|
|
|
||||
c: |
|
|
|
|
|
|
|
|
.5 |
|
|
... |
... |
|
|
|
|
, |
100000 |
|
|
|
|
|||
e |
50000 |
|
... |
... |
|
|
|
|
=.. |
|
|
|
|
|
|
|
|
"' |
|
|
|
|
|
|
|
|
" |
|
|
|
|
|
|
|
|
1/) |
|
|
|
|
|
|
|
|
|
|
|
|
|
|
|
|
|
|
·30 |
-25 |
|
-20 |
-15 |
·1 0 |
|
|
|
|
|
Scattering Angle (deg) |
|
||||
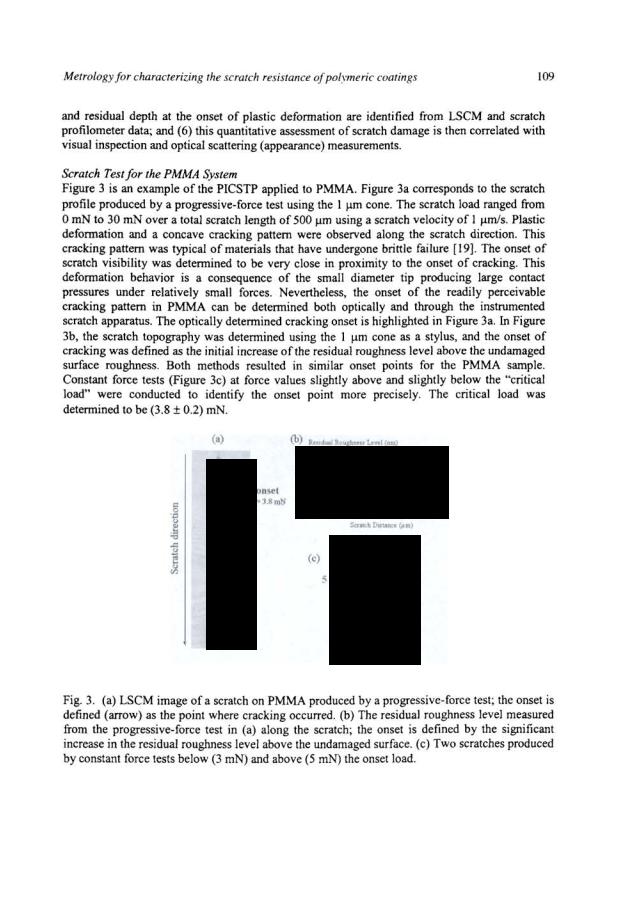
Fig. 10. Optical reflectance data as a function of scattering angle for incident angles of 20° for two EP-coatings: EP 15 and EP45. The gray shaded area shows the angular range for the gloss measurements.
Table 2. The Root Mean Square (RMS) surface roughness, Sq , measured by LSCM for the EP coating series and their corresponding 20° and 60° gloss values. Error bars represent one standard deviation (k=l), estimated from 5 measurements for surface roughness data and 6 measurements for gloss measurements.
Specimen |
Black glass |
EP45 |
EP35 |
EP30 |
EP20 |
|
EP15 |
|
||||||
|
|
|
|
|
|
|
|
|
|
|
|
|
||
Sq (5X), ).lm |
1.10 |
± 0.01 |
1.21 ± 0.03 |
1.48 |
± 0.02 |
2.02 ± 0.10 |
2.66 |
± 0.55 |
5.18 |
± |
0.28 |
|||
SQ (20X), ).lm |
0.07 |
± 0.01 |
0.16 |
+ O.Ql |
0.14 |
+ 0.03 |
0.43 ± 0.03 |
0.66 |
± 0.02 |
0.83 ± 0.03 |
||||
200 gloss |
92.0 |
±0.8 |
90.2 |
+ 1.0 |
74.0 |
+ 1.1 |
52.1 ± 2.0 |
29.3 |
± |
1.5 |
15.9 ± |
0.5 |
||
60°gloss |
96.0 |
±0.5 |
96.8 |
+ 0.5 |
95.4 |
+ 1.0 |
87.6 ± 1.5 |
74.4 |
± |
1.3 |
53.3 |
± |
1.3 |
|
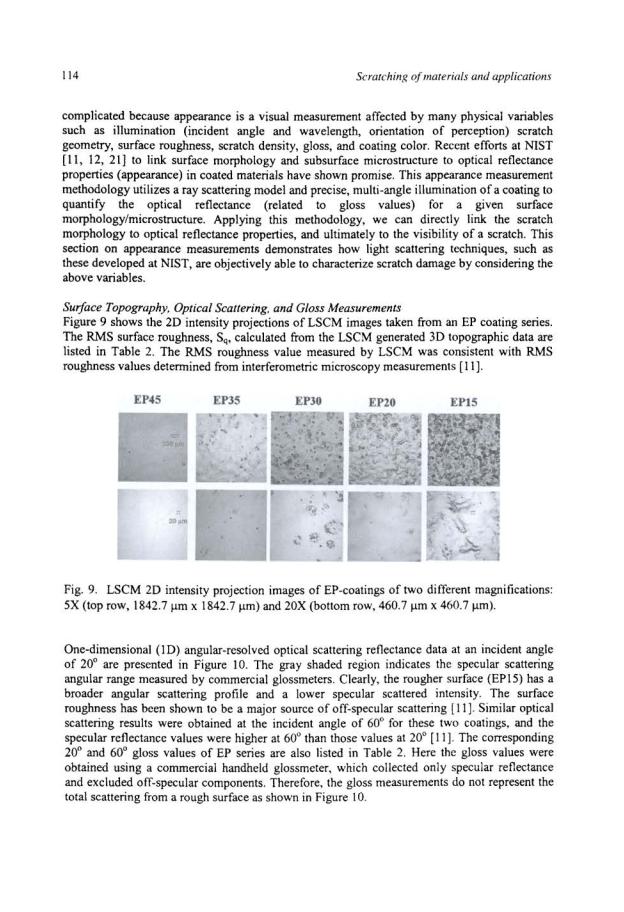
Correlation between Surface Roughness and Gloss Measurements
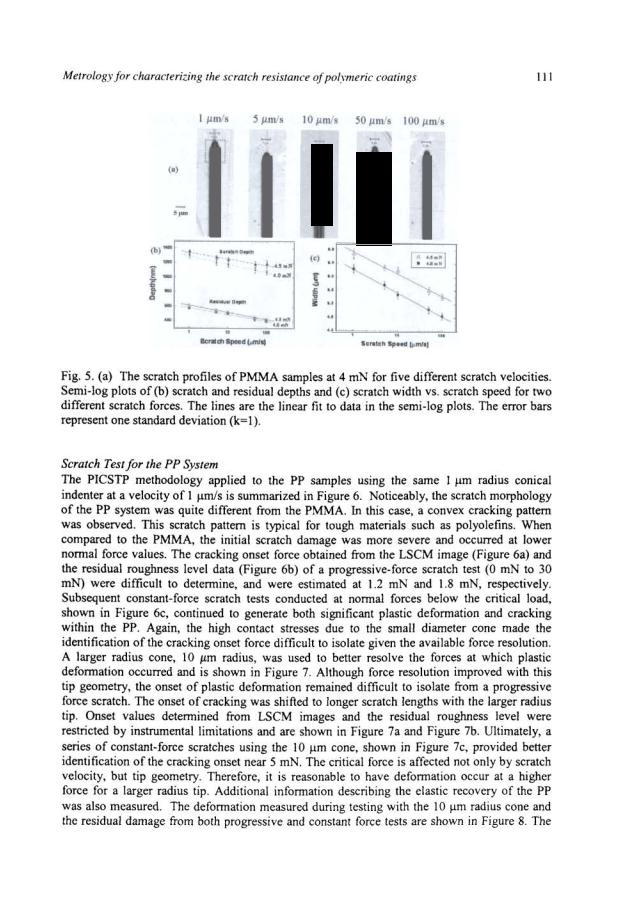
Figure 11 displays the 20° and 60° gloss values as a function of RMS surface roughness for two different measured surface areas: 5X objective (1842.7. J.lm x 1842.7. J.lm) and 20X objective (460) J.liD x 460.7 J.lm). Figure 11 clearly demonstrates that specular 20° gloss values correlate linearly to RMS surface roughness at a 20X field of view, see Figure 11b. This linear relationship is similar for the larger 5X field of view, although it fails for the roughest surfaces measured (EP15). Note that the larger 5X field of view is much closer to the area measured using a commercial glossmeter. Typically, 20° gloss measurements are applied to high gloss surfaces (low surface roughness), which have a strong specular reflectance. In the steep slope of the curve (the linear part of Figure 11a), the differences between glossy samples are clearly measured, while in the flat part (EP15, higher surface roughness) the measurement geometry no longer correlates with visual observation. Therefore, the 20° gloss measurement is not sensitive enough to distinguish between semi-gloss surfaces (when the 20° gloss value is less than 20), and a 60° measurement geometry is selected for a semi-gloss surface due to the higher specular reflectance at this angle. This phenomenon reflects a linear correlation between 60° gloss measurements and RMS surface roughness throughout the EP series at the larger field of view (Figure 11c). A deviation from linearity for the 60° measurements at the smaller field of view (5X) and smoothest EP surface is observed. This result highlights how the correlation between

116 |
Scratching of materials and applications |
surface roughness and gloss measurements is a function of the size of the area measured and the optical geometry.
100
80
.. 60
0
0'"0 40
N
20
0
100
90
.. 80
0
00'"70
co
60
50
0
""\ |
(a) |
~ |
\
~
' "~~------------...
'll:v
(c)
'¥
'
'~
s.- LSCM-SX (~m)
100 |
,, |
.., |
|
80 |
|
'"' |
|
|
(b) |
|
|
|
|
60 |
|
|
"'"· |
|
|
|
|
|
|
0 |
|
|
|
|
" |
|
|
|
|
|
|
|
|
|
|
|
|
|
|
|
|
00 |
|
40 |
|
|
""' |
|
|
|
|
|
'" |
|
|
|
} |
|
|
|
|||
N |
|
|
|
|
|
|
|
|
|
|
|
|
20 |
|
|
|
"' |
"' '"' ' |
|
|
|
|
|
0 |
|
|
|
|
|
|
|
|
|
|
|
|
|
|
|
|
|
|
|
|
100 |
|
"' |
'< |
|
|
(d) |
|
|
|
|
|
90 |
|
|
|
|
|
|||
.., |
|
|
|
|
~ |
|
|
|
|
|
|
80 |
|
|
|
"" "< |
|
|
|
||
0 |
|
|
|
|
|
|
|
|
||
00'"70 |
|
|
|
|
|
|
||||
co |
|
|
|
|
|
|
""'v |
|
|
|
|
|
60 |
|
|
|
|
|
|
||
|
|
|
|
|
|
|
|
|
||
|
|
50 |
|
|
|
|
|
"" |
|
|
|
|
0.0 |
0.2 |
0.4 |
0.6 |
|
0.8 |
1.0 |
||
s.- LSCM-20X (~m)
Fig. 11. Comparison between RMS surface roughness values and 20° and 60° gloss values of EP-coatings for two different surface measurement sizes: 5X objective (1842.7 11m x 1842.7 11m) and 20X objective (460.7 11m x 460.7 11m). The lines represent the best fits for the data: polynomial fit to 20° gloss values at 5X LSCM magnification and linear fit for the rest of plots.
However, gloss measurements quantify only the specular contribution to the roughness scattering intensity. There is still information about roughness present in the off-specular scattering intensity. The off-specular scattering contribution may be quantified by the ratio of off-specular intensity to specular intensity. For example, if the area under the off-specular scattering intensity (the intensity outside the gray area in Figure 10) is integrated and normalized by the specular scattering intensity (the equivalent 20° gloss value from inside the gray area in Figure 10, a ratio of69% for EP45 (smooth) and 37% for EP15 (rough) coatings is calculated. Note that for these samples the 20° gloss values decrease more than 30 %. Therefore, gloss values may represent the differences in surface roughness when the offspecular contribution is weak. When considering scratch damage on a surface, the off-specular scattering contribution becomes significant, and should be considered to evaluate surface damage.
Characterization ofDamage from Mar or Multiple Scratches
A high density of shallow scratches on a coating causes marring. Marring results in an overall reduction of surface gloss and, correspondingly, an increase in haze. Traditionally, mar is only quantified as either a damaged or undamaged surface from gloss measurements. This is an acceptable methodology for two main reasons. First, due to the inherent diffusive scattering from a marred surface, it is difficult to link an optical gloss value to the type and degree of mar damage (RMS roughness). Therefore, it is only possible to rank material performance after gross marring is observed. Second, for a coating exposed to light marring, the only method to visualize the scratches is by evaluating the off-specular reflection, as an observer would do by tilting a sample. Commercial glossmeters are not sensitive to this information, and therefore