

книги / FISMA and the risk management framework the new practice of federal cyber security
..pdfMechanical analysis of the scratching properties ofcoated polymers |
7 |
Figure 2 gives a schematic representation of the evolution of the rear angle as a function of the mean contact strain & . The strain is assumed to be simply proportional to the ratio of the contact radius to the tip radius for a spherical tip and one may note that there exists no clear definition of the scratching mean strain linking the geometry of the contact and the friction coefficient. lie and lip denote the contact strains at the end of the elastic contact area and the beginning of the plastic contact area, respectively. In the case of a viscoelastic contact the rear angle (!) is equal to ;r/2 for elastic deformation. If the material displays strain hardening, the contact strain decreases and (!) increases [32]. As the strain rate and temperature vary, even under constant loading, the contact area may also vary considerably and the strain near the contact may change from viscoelastic to viscoplastic.
rtf2
|
1.4 |
• |
uncoated CR39 |
|
o |
coating 4.38~m |
|
|
|
||
|
1.2 |
|
|
|
1.0 |
fp coating 4.38~m |
|
::0.. |
|
|
|
- |
0.8 |
|
|
80.6
0.4
0.2
|
|
|
|
|
|
|
|
|
Smooth tip |
||||
|
0.0 +-.--.~,--.--.--.---,--..-........--.-.---.~r-'--1 |
||||||||||||
|
0.0 |
0.1 |
0.2 |
0.3 |
0.4 |
0.5 |
0.6 |
0.7 |
0.8 |
0.9 |
1.0 |
||
|
rtf2 |
|
|
|
|
|
|
|
|
|
|
|
|
|
|
|
|
|
|
o |
uncoated CR39 |
|
|||||
|
1.4 |
|
|
|
|
|
|
|
|||||
|
|
|
|
|
|
|
• |
coating 4.38~m |
|
||||
|
|
|
|
|
|
|
|
|
|||||
-.... |
1.2 |
|
|
|
|
|
|
|
|
|
|
|
|
1.0 |
|
|
|
|
|
fp coating 4.38~m |
|
|
|||||
|
|
|
|
|
|
|
|
|
|
|
|
||
0.8 |
|
|
0 |
|
|
\ |
|
|
|
|
|
|
|
""0 |
|
|
|
|
|
|
|
|
|
|
|
|
|
-8 |
|
|
fe |
|
|
|
t•• |
|
|
|
|
|
|
0.6 |
|
|
|
|
|
|
|
|
|
|
|||
|
|
|
|
|
|
|
|
|
|
|
|
||
|
0.4 |
|
|
|
|
|
|
|
|
|
|
|
|
|
0.2 |
|
|
|
|
|
|
|
Rough tip |
|
|||
|
|
|
|
|
|
|
|
|
|
||||
|
0.0 + |
-.--.~,--.--.--.---,--..-.....,-.-.--ro..-,.....;..-i |
|
||||||||||
|
0.0 |
0.1 |
0.2 |
0.3 |
0.4 |
0.5 |
0.6 |
0.7 |
0.8 |
0.9 |
1.0 |
||
a/Rtip
Fig. 3. Rear contact angle versus contact strain for uncoated CR39 and samples with a 4.38 Jlm coating. Plastic contact seems to begin at a higher contact strain in the presence of a thick coating.
The evolution of the rear contact angle as a function of the contact strain for polymer samples with no coating and a 4.38 Jlm coating is presented in Fig. 3. Whatever the roughness of the tip, the end of the elastic domain seems to remain constant. In contrast, the elastic-plastic domain

8 |
Scratching of materials and applications |
seems to expand if a thick coating has been deposited on CR39, with the result that the plastic domain begins at a higher contact strain for thickly coated samples. The thin coating presents a less clear evolution (data not shown).
Contact pressure
The contact pressure is the ratio of the normal load to the true contact area, which is the sum of the front and rear areas. It may be called the scratch hardness only in the case of plastic contact. Figure 4 shows the mean contact pressure as a function of the contact strain for all three types of polymer sample. As previously seen, there is no large difference in the responses to the two tips. On the uncoated material, scratched by the smooth tip, the contact pressure increases from 90 to 140 MPa and then seems to decline as the ratio a/R1;p exceeds 0.4, whereas on the 4.38 mm coating the contact pressure increases continuously. In view of the evolution of the rear angle, one may assume that the contact behaviour of the thickly coated sample is essentially elasticplastic.
160 |
|
|
|
|
|
|
|
|
|
|
|
|
|
|
|
|
|
|
|
---o~ uncoated CR39 |
|
||||
|
|
|
|
|
|
|
|
|
||||
|
|
|
|
|
|
|
|
---coating 1.10~m |
|
|||
140 |
|
|
|
|
|
|
|
-----coating 4.38~m |
|
|||
(il120 |
|
|
|
|
|
|
|
|
|
|
||
c... |
|
|
|
|
|
|
|
|
|
|
||
:::2: |
|
|
|
|
|
|
|
|
|
|
|
|
- 100 |
|
|
|
|
|
|
|
|
|
|
|
|
<.> |
|
|
|
|
|
|
|
|
|
|
|
|
a. |
|
|
|
|
|
|
|
|
|
|
||
80 |
|
|
|
|
|
|
|
|
|
|
|
|
60 |
|
|
|
|
|
|
|
|
Smooth tip |
|
||
|
|
|
|
|
|
|
|
|
||||
|
|
|
|
|
|
|
|
|
||||
|
|
|
|
|
|
|
|
|
|
|||
0.0 |
0.1 |
0.2 |
0.3 |
0.4 |
0.5 |
0.6 |
0.7 |
0.8 |
||||
|
|
|
|
|
|
|
a/Rtip |
|
|
|
|
|
|
|
|
-o- uncoated CR39 |
|
|
|
|
|
|
|||
|
|
|
|
|
|
|
|
|
||||
140 |
|
|
_ , _ coating 1. 1O~m |
|
|
|
|
|
|
|||
|
|
-----coating 4.38~m |
|
|
|
|
|
|
||||
|
|
|
|
|
|
|
|
|
||||
{ij120 |
|
|
|
|
|
|
|
|
|
|
||
c... |
|
|
|
|
|
|
|
|
|
|
||
~100 |
|
|
|
|
|
|
|
|
|
|
|
|
<.> |
|
|
|
|
|
|
|
|
|
|
|
|
a. |
|
|
|
|
|
|
|
|
|
|
||
80 |
|
|
|
|
|
|
|
|
|
|
|
|
60 |
|
|
|
|
|
|
|
|
Rough tip |
|
||
|
|
|
|
|
|
|
|
|
|
|
|
|
|
|
|
|
|
|
|
|
|
|
|
|
|
0.0 |
0.1 |
0.2 |
0.3 |
0.4 |
0.5 |
0.6 |
0.7 |
0.8 |
||||
|
|
|
|
|
|
|
a/Rtip |
|
|
|
|
|
Fig. 4. Contact pressure as a function of the contact strain.

Mechanical analysis of the scratching properties of coated polvmers |
9 |
Friction coefficients |
|
Figure 5 shows the evolution of the apparent friction coefficient |
|
Jlapp=Ft/Fn |
(2) |
as a function of the ratio a/l?J;p for the two tips and all samples. In the case of the smooth tip the effect of the thickness of the coating on the apparent friction coefficient is clear: the friction decreases as the thickness increases. The same tendency is observed for the rough tip provided the thickness is greater than the roughness of the tip.
c 0.7.----~~--.--~~-....--,~-.--, |
|
|
||||||||||
Q) |
|
~o~ uncoated CR39 |
|
|
|
B-d' |
||||||
:~ |
0.6 |
~,.__coating 1.10~m |
|
|
~,usdl |
|||||||
:::: |
|
--coating 4.38~m |
|
0~/ |
|
|
|
|
||||
Q) |
|
|
|
|
|
|
||||||
0 |
0.5 |
|
|
|
|
|
|
|
|
|
|
|
u |
|
|
|
|
|
|
|
|
|
|
|
|
§ |
0.4 |
|
|
|
|
|
0 |
··· - ' |
|
|
|
|
|
|
|
|
|
_......... |
|
.. |
|
|
|
||
:g 03 |
|
|
|
|
~..:"~:1 |
___.......__._.. |
|
|
|
|
||
- |
|
|
|
~----~·· |
|
|
|
|
|
|||
~ |
02 |
|
|
|
|
|
|
|
|
|
|
|
..... |
|
|
|
|
|
|
Smooth tip |
|||||
~ |
0 1 +--~~---.-~~-.......,~-.--1 |
|
||||||||||
a. |
0.0 |
0.1 |
0.2 |
0.3 |
0.4 |
0.5 |
0.6 |
0.7 |
0.8 |
|||
<C |
|
|
|
|
|
a/Rtip |
|
|
|
|
|
|
c 0.7 .---....--,~--,--....,--~-~___,---,--.--, |
|
|
||||||||||
Q) |
|
|
Rough tip |
|
|
|
|
|
|
|
|
|
:~ |
0.6 |
|
|
|
|
|
|
|
|
|
||
|
|
|
|
|
|
|
|
|
|
|
||
:::: |
|
|
|
|
|
|
|
|
|
|
|
|
Q) |
|
|
|
|
|
|
|
|
|
|
|
|
0 |
0.5 |
|
|
|
|
|
|
|
|
|
|
|
u |
|
|
|
|
|
|
|
|
|
|
|
|
c |
|
|
|
|
|
|
|
|
|
|
|
|
.Q 0.4 |
|
|
|
|
|
|
|
|
|
|
|
|
u |
0.3 |
|
|
|
|
|
|
|
|
|
|
|
·;;:: |
|
|
|
|
|
|
|
|
|
|
|
|
- |
|
|
|
|
|
--~ coating 1.1 O~m |
|
|
|
|||
~ 0.2 |
|
|
|
|
--coating 4.38~m |
|
|
|
||||
..... |
|
|
|
|
|
|
|
|
|
|
|
|
~ 0 1 +-.......,~--,---,--~-~___,--,----.---j |
|
|
||||||||||
|
||||||||||||
a. |
0.0 |
0.1 |
0.2 |
0.3 |
0.4 |
0.5 |
0.6 |
0.7 |
0.8 |
|||
<C |
|
|
|
|
|
a/Rtip |
|
|
|
|
|
|
Fig. 5. Experimental values of the apparent friction coefficient as a function of a/l?J;p for all polymer samples and the two tips.
If the ratio of the local shear to the local pressure is termed the "true friction coefficient" f..l , then the apparent friction coefficient may be written as [39]:
fJ.__ _ C+Df.1
Fn -f.lnpp- A+BJ.l
(3)

10 Scratching of materials and applications
Solution of this relation between the true and apparent friction coefficients requires calculation of the four integrals A, B, C and D, which are the local pressure and shear elementary action integrals, together with a knowledge of the rear angle (JJ, the real contact area and the geometry of the tip. A, B, C and D take into account the macroscopic contact shape. However, the true friction coefficient refers to a smooth tip. If the tip is rough, this coefficient of the true friction between tip and surface must be called the "local friction coefficient" because the roughness effect cannot be removed. Figure 6 presents the local friction coefficient as a function of the
ratio a/l?Jip for all samples and the two tips. At higher values of the contact strain (greater than 0.4), the local friction coefficient does not significantly depend on the contact strain, is greater for the rough tip and smaller when the thickness of the coating is greater than the roughness of the tip.
c |
|
-o- uncoated CR39 |
|
|
|
|
|
-Q) |
0.5 |
->-coating 1.10~m |
|
·u |
|
--coating 4.38~m |
|
;;:: |
|
|
|
(j) |
0.4 |
|
|
0 |
|
|
|
(.) |
0.3 |
|
|
c |
|
|
|
0 |
|
.·---.:!..._~·-··-.-/"----·-··--tl |
|
i3 0.2 |
|
||
- |
|
·-------.----......._........-.... |
|
·;:: |
|
|
|
0 . 1 |
|
|
|
~ |
|
Smooth tip |
|
o |
o.o+-.------,~-,-~~~--.---~~--.~----'---1 |
|
|
...J |
0.0 0.1 0.2 0.3 0.4 0.5 0.6 0.7 0.8 |
||
a/Rtip
C:Rough tip
Q) |
0.5 |
|
·u |
|
|
;;:: |
|
|
(j) |
0.4 |
|
0 |
|
|
(.) |
0.3 |
|
c |
|
|
0 |
|
|
i3 |
0.2 |
|
- |
|
---D- uncoated CR39 |
·;:: |
|
|
0 . 1 |
- • - coating 1.1 O~m |
|
co |
|
_._ coating 4.38~m |
(.) |
|
|
0 |
0.0 +-~~--.~~~--.---~~--.---.,.-~---! |
|
...J |
0.0 0.1 |
0.2 0.3 0.4 0.5 0.6 0.7 0.8 |
a/Rtip
Fig. 6. Estimation of the local friction coefficient as a function of a/l?Jip for all polymer samples and the two tips.
Groove recovery
Since if cracking appears the recovery of the groove may be hindered, this section relates to grooves which stay ductile after scratching. Comparison of the recovery of different grooves was thus made in a particular configuration: the normal load was fixed at 0.64 N to generate scratches with a minimum yield, so as to have the time to record the groove profiles without having a fully plastic contact. The tests selected were uncoated CR39 scratched by the two tips
Mechanical analysis of the scratching properties of coated polymers |
II |
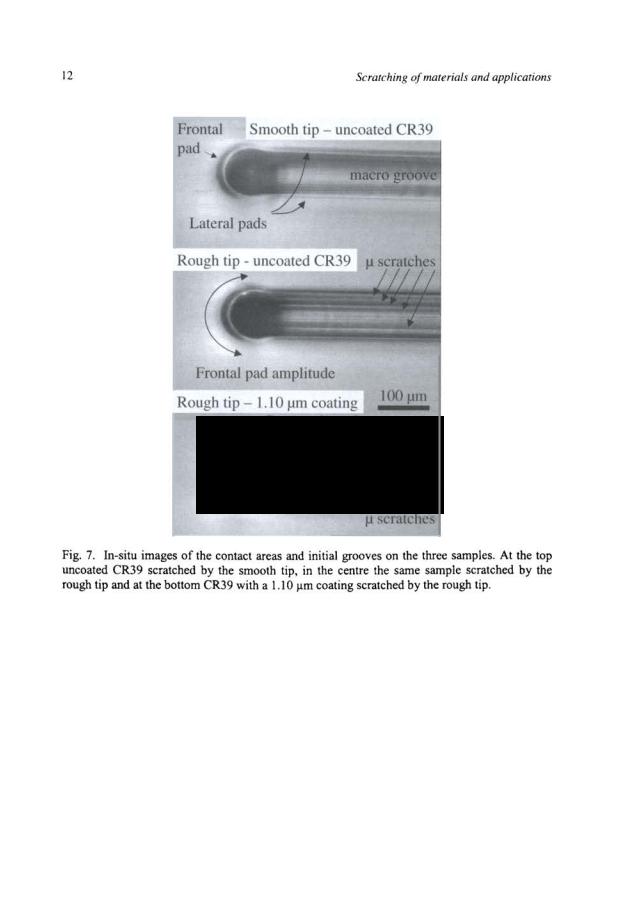
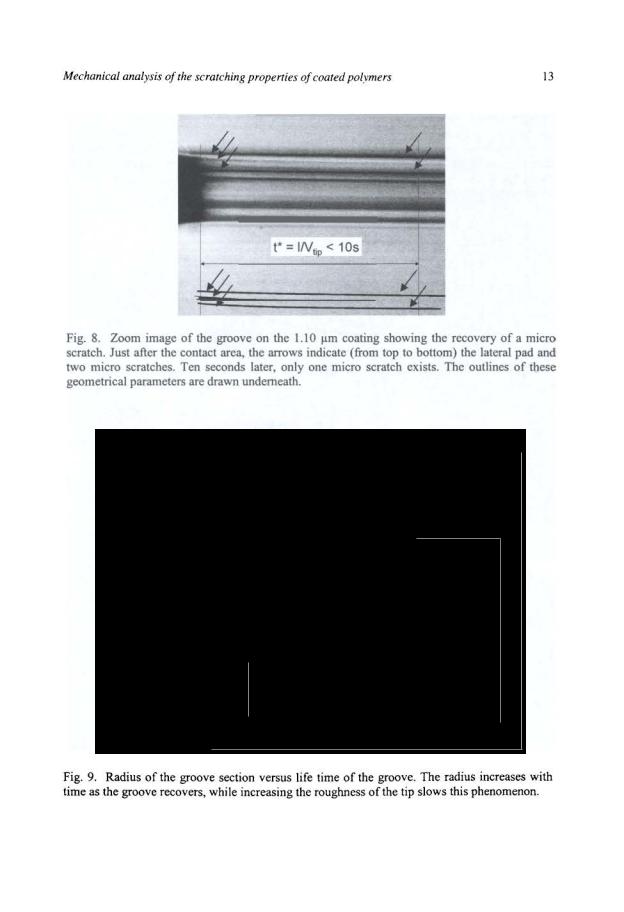
and CR39 with a 1.10 )lm coating scratched by the rough tip. Under this normal load, the contact strain lies in the range 0.4 to 0.45, the local friction coefficient has its asymptotic value of 0.3 to 0.35 and cracking never appears. The recovery of samples with a 4.38 )lm coating was not tip sensitive and it can be clearly seen in Figure 1 that for such samples one cannot justify recording the groove profile for a minimum period of time. Experiments were performed at 30°C, the first profile was recorded 9 minutes after scratching and 6 further profiles were recorded during the next 6000 minutes. Figure 7 shows the in-situ contacts and the grooves initially created on the three samples. As previously, the number of micro scratches on the imprint of the groove decreases if the sample has been coated, as does the size of the frontal push pad. Two important points should be noted: under the chosen experimental conditions, the width of the groove remains constant and its shape does not resemble a flame. Micro scratches generated by the roughness of the tip can recover and the number of micro scratches decreases with time (see arrows drawn on Figure 8). The life time of a micro scratch as recorded on this photograph is the ratio of the scratch length to the sliding speed
t*=-l- |
(4) |
|
Vrip |
||
|
and is typically about 10 s. After scratching, the size and shape of the groove left on a sample was analysed using a commercial mechanical profile recorder and the radius of the section of the groove was estimated by fitting the profile data. This radius increases with the life time of the groove as seen in Fig. 9. If at 10 minutes, the sections generated by the rough tip are of the same order of magnitude, at 6000 minutes the radius of the groove section is clearly higher on the coated sample. At both time points, the radius of the groove section is greater for the smooth tip. Figure 9 also shows interferometric profiles of the grooves at two time points. These profiles clearly demonstrate that micro scratches on the coating are more open than micro scratches on the uncoated samples and that the radii increase with time.

14 Scratching of materials and applications
DISCUSSION
Analysis ofcontact results
In the case of the smooth tip and high contact strain, the local friction coefficient decreases as the thickness of the coating increases, while for the rough tip the tendency would seem to be the same, but is not as marked. During these tests at constant temperature and normal load, the mean strain rate varies over nearly one decade.
100 |
|
|
|
|
|
|
|
|
|
|
|
|
|
|
|
|
|
|
|
|
|
|
|
|
..-... |
80 |
|
|
|
|
|
|
|
|
|
|
|
|
|
|
|
|
|
|
|
|
|
|
|
<1l |
|
|
|
|
|
|
|
|
|
|
|
|
|
|
|
|
|
|
|
|
|
|
|
|
a.. |
|
|
|
|
|
|
|
|
|
|
|
|
|
|
|
|
|
|
|
|
|
|
|
|
~ |
60 |
|
|
|
|
|
|
|
|
|
|
|
|
|
|
|
|
·1 . |
|
|
|
|||
Q. |
|
|
|
|
|
|
|
|
|
|
|
|
|
|
|
|
|
|
|
|
||||
-E |
40 |
|
|
|
|
|
|
|
|
|
|
|
|
|
|
dE/dt s |
|
|
|
|
||||
|
|
|
|
|
|
|
|
|
|
|
|
|
|
|
|
|
|
|||||||
0 |
|
|
|
|
|
|
|
|
|
|
|
|
|
|
0 |
|
1E-1 |
|
|
|
|
|||
b" |
|
|
|
|
|
|
|
|
|
|
|
|
|
|
|
|
|
|
|
|
||||
|
|
|
|
|
|
|
|
|
|
|
|
|
|
|
. 1E·2 |
|
|
|
|
|||||
Q) |
20 |
|
|
|
|
|
|
|
|
|
|
|
|
|
|
- |
|
|
|
|||||
:::J |
|
|
|
|
|
|
|
|
|
|
|
|
|
|
|
|
1E-3 |
|
|
|
||||
,_ |
|
|
|
|
|
|
|
|
|
|
|
|
|
|
|
|
|
|
|
|
|
|||
I- |
|
|
|
|
|
|
|
|
|
|
|
|
T=20°C • |
1E-4 |
|
|
|
|
||||||
|
0 |
|
|
|
|
|
|
|
|
|
|
|
|
|
|
|
|
|
|
|
|
|
|
|
|
|
|
|
|
|
|
|
|
|
|
|
|
|
|
|
|
|
|
|
|
|
|
|
|
|
0.00 |
|
|
0.05 |
|
|
0.10 |
|
0.15 |
|
|
|
|
|
|
|
||||||||
|
|
|
|
|
|
|
|
|
0.20 |
|||||||||||||||
|
|
|
|
|
|
|
|
|
|
True strain |
|
|
|
|
|
|
|
|
|
|||||
ro |
|
|
|
|
|
|
|
|
|
|
|
|
|
|
|
|
|
exp. |
|
function |
||||
-a |
200 |
|
|
|
|
|
|
|
|
|
|
|
|
|
|
|
datas |
|
datas |
|||||
~ |
|
|
|
|
|
|
|
|
|
|
|
|
|
|
|
|
||||||||
|
|
|
|
|
|
|
|
|
|
0 . |
|
|
|
|
|
|
|
<) |
+90'C |
|||||
|
|
|
|
|
|
|
|
|
|
|
|
|
|
|
|
|
|
|||||||
-:;; 175 |
|
|
|
|
. |
|
|
|
|
|
|
|
|
|
l> |
+70'C |
||||||||
|
|
|
|
|
|
|
|
|
|
|
|
|
|
|
|
|
||||||||
]! 150 |
|
|
|
|
|
|
|
|
|
|
|
|
|
0 |
+60'C |
|||||||||
|
|
|
|
|
|
|
|
|
|
|
|
|
|
|||||||||||
|
125 |
|
|
|
|
c |
|
|
|
|
|
|
|
~ |
+20'C |
|||||||||
Q) |
|
|
|
|
|
|
|
|
|
|
|
|
|
|
c |
-20'C |
||||||||
|
|
|
|
|
|
|
|
|
|
|
|
|
|
|
|
|||||||||
-(/)"~ 100 |
|
|
|
|
7 . |
|
|
... |
|
." |
~ |
|
|
|
|
|
|
|
|
|||||
|
|
|
|
|
|
|
|
|
|
|
|
|
|
|
||||||||||
(/) |
75 |
|
|
|
|
|
|
|
|
|
|
|
|
|
|
|
|
|||||||
,Q) |
|
|
|
|
|
|
|
|
|
|
|
|
|
|
|
|
||||||||
0.. |
50 |
|
|
" |
|
.&·- ._ "6. ... |
|
|
|
|
|
|
|
|
|
|
||||||||
E |
|
|
|
|
|
|
|
0 |
0 |
|
|
|
|
|
|
|
|
|||||||
25 |
|
|
|
|
|
l> |
|
|
|
|
|
|
|
|||||||||||
0 |
|
|
|
|
|
|
l> |
|
|
|
|
|
|
|
|
|
||||||||
|
|
|
|
|
|
|
|
|
|
|
|
|
|
|
|
|||||||||
() |
0 |
|
|
|
|
|
|
0 • |
0 |
|
- |
•o |
<) |
|
|
|
|
|
|
|
|
|||
|
|
|
|
|
|
|
|
|
|
|
|
|
|
|
||||||||||
Q) |
|
----5 1E-4 1E-3 |
0 01 |
|
|
0.1 |
|
|
10 |
|
|
|
|
|
||||||||||
1E |
|
|
|
|
|
|
|
|
|
|||||||||||||||
:::J |
|
|
|
|
|
|
|
|
|
|
|
|
|
|
1 |
|
|
|
|
|
|
|
|
|
, |
|
|
|
|
|
|
|
|
|
d£/dt |
(5 |
|
|
|
|
|
|
|
|
|
||||
- |
|
|
|
|
|
|
|
|
|
) |
|
|
|
|
|
|
|
|
|
|||||
|
|
|
|
|
|
|
|
|
|
|
|
|
|
|
|
|
|
|
|
|
|
|
|
|
Fig. 10. True compressive stress versus true strain (top) and comparison of the extrapolated function with the experimental yield stress as a function of the strain rate over a range of temperatures and strain rates (bottom). The experimental data and extrapolated function correlate over a wide range of temperatures.
It is well known that below the glass temperature, the yield stress of polymeric materials increases linearly with the logarithm of the strain rate as predicted by Eyring's law. Just as the scratch hardness was classically written as a function of the yield stress, the contact pressure may be written as a function of the yield stress with a factor c depending on the contact strain:

Mechanical analysis of the scratching properties of coated polymers |
15 |
(5)
This ratio of the contact pressure to the yield stress, called the normalised contact pressure, is time and temperature independent and depends only on the strain in the contact area [34]. The major assumption made here is the decoupling of the strain dependency and the temperature and velocity dependency. In the case of an elastic or plastic contact the factor c is linked to the ratio
E.an. . The contact pressure p(T,;) should thus be normalised by the yield stress uy(T;) for
C1'yJelt1IVlp
the same values of(r,;) . Figure I0 shows on the left the stress-strain curves at one temperature and several strain rates and on the right the yield stress estimated from these tests as a function of the strain rate. Using these values, an extrapolated function was derived which allows one to estimate the yield stress to a good approximation over a wide range of temperatures and scratching velocities. Thus, the yield stress was fitted with a second degree polynomial law to estimate the values at strain rates comparable to those in scratch tests ( I0-2 to
• •
a-r(&,1)=a(1)+b(1)log&+c(1)(log&)2 (6)
2.0~~~~~~~~-~~-~~-,
|
1.8 |
|
|
|
|
|
|
|
|
|
|
|
|
1.6 |
|
|
|
|
|
|
|
|
|
|
|
|
1.4 |
|
|
|
|
|
|
|
|
|
|
|
~ 1.2 |
|
|
|
|
|
|
|
|
|
|
|
|
·;;._ |
|
|
|
|
|
|
|
|
|
|
|
|
0 |
1.0 |
|
|
|
|
|
|
|
|
|
|
|
-.....() |
0.8 |
|
|
|
|
|
|
|
|
|
|
|
Cl. |
0.6 |
|
|
|
|
|
|
|
|
|
|
|
|
|
|
|
|
|
|
|
|
|
|
|
|
|
0.4 |
|
|
o |
uncoated CR39 |
|
|
|
|
|
||
|
|
|
• |
coating 1. 1O~m |
|
|
|
|
|
|||
|
0.2 |
|
|
Smooth tip |
|
|
||||||
|
|
|
• |
coating 4.38j.Jm |
|
|
||||||
|
|
|
|
|
|
|||||||
|
|
|
|
|
|
|
|
|
|
|
|
|
|
|
|
|
0.1 |
0.2 |
0.3 |
0.4 |
0.5 |
0.6 |
0.7 |
0.8 |
|
|
|
|
|
|
|
|
a/Rtip |
|
|
|
|
|
|
2.0..-~~--r~--.-~~-~~-~~-, |
|||||||||||
|
1.8 |
|
|
|
|
|
|
|
|
|
|
|
|
|
|
|
|
|
|
|
|
|
|
|
|
|
1.6 |
|
|
|
|
|
|
|
|
|
|
|
|
1.4 |
|
|
|
|
|
|
|
|
|
|
|
~ 1.2 |
|
|
|
|
|
|
|
|
|
|
|
|
0 "'1.0 |
|
. |
|
|
|
|
|
|
|
|
|
|
|
|
|
|
|
|
|
|
|
|
|||
..._ |
|
|
|
|
|
|
|
|
|
|
|
|
" |
0.8 |
|
|
|
|
|
|
|
|
|
|
|
Cl. |
0.6 |
|
|
|
|
|
|
|
|
|
|
|
|
|
|
|
|
|
|
|
|
|
|
|
|
0.4• uncoated CR39
0.2 |
• |
coatmg1.10lJm |
Rough tip |
|
• |
coating 4.38~m |
0.0*--~-~~~---~---..:=-r-~
0.0 0.1 0.2 0 3 0 4 0.5 0.6 0.7 0.8
a/Rtip
Fig. 11. Evolution of the normalised contact pressure as a function of the mean contact strain for the two tips. For the 4.38 J.!m coating, the yielding seems to be retarded: the normalised contact pressure reaches a value of about 1.6 for a large value of the mean contact strain.
16 |
Scratching of materials and applications |
A thin polymeric coating deposited on a polymeric substrate (typically a few microns thick for a contact width of about 80 J.tm) will not modify the global mechanical response to an indenter. O'Sullivan et. a!. [36] have shown that for a spherical tip sliding over a layered elastic halfspace, the radius of the contact zone and the pressure under the centre of the indenter differ significantly from the Hertzian case only when the Young's modulus of the coating differs significantly from that of the substrate. Since in our experiments the ratio of the contact width to the thickness of the coating was greater than 10 for the lowest normal load and the Young's moduli of the two materials were of the same order of magnitude, the coating should not have influenced the bulk behaviour, contact geometry or contact pressure. Consequently, all the contact pressures may be normalised by the extrapolated function of the yield stress for CR39 under compression. During elastic static contact, yield occurs when the normalised contact pressure is equal to 1.1 for a Poisson's ratio of 0.3 and perfectly elastic-plastic behaviour [35]. This result may be used as an upper boundary for a sliding test where the friction favours yielding. When the normalised contact pressure is plotted against the contact strain (Figure II), it is clear that the coating prevents yielding. At a given contact strain, the normalised contact pressure is lower if the sample has been coated. The estimated local friction coefficient shown
in Figure 6 displays a large variation (O.I5 to 0.4). At a ratio a/l?J,P of 0.4, the contact width is 90 11m and the depth of penetration of the tip almost IO J.tm. As the coating has a Young's modulus only twice that of the substrate, its improvement of the scratch resistance must be investigated primarily as an effect due to decreasing the friction coefficient.
Numerical simulation to identify the friction dependency
Although indentation or scratch tests permit easy determination of a mean contact pressure, interpretation of the stress-strain curves is often difficult. Hence the contact behaviour was modelled using the CAST3M © code. The mesh procedure Demete version 2.0. beta © (CENSEMT - P Verpeaux) was employed and the finite element mesh was a right-angled parallelepiped. The domain elements were three-dimensional meshes with ten-node tetrahedra and the mesh was refined under the contact area. Elliptical contact pressure and shear stress distributions were used to model the contact between a spherical tip and the surface. During calculation, the normal load was increased step by step while the contact radius stayed constant.
Despite the fact that the elasticity of polymers is often non linear at a given temperature and strain rate, the elastic behaviour was modelled by a linear incremental law defined by Young's modulus E and Poisson's ratio v, both taken to be constant. E and v were determined in a compressive test. The flow stress was described by a G'sell-Jonas law [33]:
|
(7) |
where ivp and &vp are respectively the generalised viscoplastic strain rate and strain and |
k is |
the consistency, ar a thermal coefficient, hg the strain hardening coefficient and m |
the |
sensitivity to the strain rate. In the formalism ofG'sell and Jonas, the term &-e-•<·')describes the viscoelastic behaviour under loading but does not model the elastic unloading of the
deformation |
and hence this term was not considered in the present work ( ~5000 and |
1-e-we,p ""1 |
). In our simulation, the elastic recovery was directly related to the ratio of the |