книги / FISMA and the risk management framework the new practice of federal cyber security
..pdf
222 |
Scratching of materials and applications |
CONCLUSIONS
(1)Sputter-cleaning of substrate helps to improve TiB2 coating hardness and adhesion strength.
(2)The TiB2 coatings produced with substrate bias possess low hardness, but good adhesion with the substrate. With biasing at the early stage of deposition, the failure mode is changed from compressive spallation to wedge spallation, which obviously shows the improvement in coating adhesion strength.
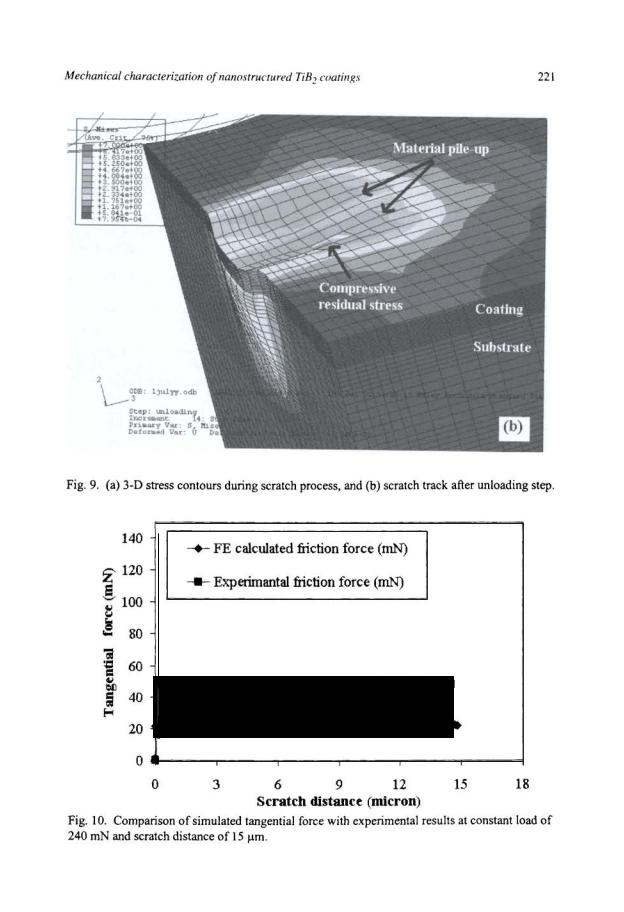
(3)A FE model has been developed to study and simulate the scratch process. The model is applied under assumption of step-wise loading, and scratch, and can be used to simulate the loading, scratching and unloading stages, the plastic deformation behaviour of the coating and the substrate during the scratch test.
(4)The present model can be used for estimation of the adhesion force between the stylus and the coating surface.
REFERENCES
1.Munro, R.G. (2000) J. Res. Nat/. Jnst. Stand. Techno/. 105, 709.
2.Cutler, R.A. (1991). Engineering properties of borides. Engineering Materials Handbook: Ceramic and Glasses. ASM International, Vol. 4.
3.Berger, M., Coronel, E., Olsson E. (2004) Surf Coat. Technal. 185, 240.
4.Berger, M., Karlsson, L., Larsson, M., Hogmark, S. (2001) Thin Solid Films 401,179.
5.Panich, N., Sun, Y. (2005) Suif. Coat. Technal. 198, 14.
6.Oliver W C, Pharr G M. (1992) J. Mater. Res. I992;7: 1564I583.
7.Xia, J., Li, C.X., Dong, H., and Bell, T. (2004)1. Mater. Res. 19,291.
8.Xia, J., Li, C.X., Dong, H., and Bell, T. (2004) J. Mater. Res. 19, 291.
9.Wong, M., Lim, G.T., Moyse, A., Reddy, J.N., Sue, H-J. (2004) Wear 256, 1214.
10.Holmberg, K., Laukkanen, A., Ronkainene, H., Wallin, K., Vmjus, S. (2003)
Wear 254, 278.
11.Hibbitt, Karlsson and Sorensen Inc. ( 1998) ABA QUS. User's Manual. Pawtucket. RI, Ver 6.3.
12.Salas, 0., Keams, K., Carrera, S., Moore, J.J. (2003) Surf Coat. Technal. 172, 117.
223
CHAPTER II
DAJ\tiAGE IDENTIFICATION OF DLC COATING BY MICROSCRATCH TEST
A.DJAMAI*, H. ZAIDI*, K. 1. CHIN* and T. MATHIA**
*Universite de Poitiers, Laboratoire LMS (UMR-6610- CNRS), SP2MI, Tehiport 2, Boulevard Marie et Pierre Curie, BP 30179, 86962 Futuroscope Chasseneuil Cedex, France.
**Ecole Centrale de Lyon. Laboratoire de Tribologie et Dynamique des Systemes (UMR-5513- CNRSj,36, Av. Guy de Co!longue, 69134 Ecully, France. E-mail: djamai@lms. univ-poitiers.fr
ABSTRACT
In order to characterize the adherence of DLC coatings (Diamond Like Carbon), scratch testing was performed on a unit equipped with sensors for normal and tangential forces, and an acoustic detector to detect the nucleation and the propagation of cracks. The system is also equipped with a microscope permitting observation of each event on the scratch according to the tangential friction force signal or the acoustic signal. The local microscopic observation allows identification of the damage with respect to the normal load. The test was performed with a Rockwell C indenter at the relative displacement speed v = I 0 mm/min under a progressive normal load from 5 to 55N.
Coating failure appears in various modes, particularly the following : propagation of the cracks along the longitudinal edges of the scratch; propagation in front of the indenter; rupture along the. maximum principal stress lines; and. detachment in the subsurface by shearing of the coating. The microscopic analysis of the evolution of the scratch under a progressive normal load permits identification of the various traces and the damage mechanisms of the coating.
In this study, experimental results are shown for the scratch tests on bulk glass and DLC coating. Various modes of crack initiation, damage and rupture of these materials according to the critical normal load are presented. The analysis of the contact stress field distribution in bulk glass enables identification of the crack initiation and its propagation in the coating.
KEYWORDS
DLC coating, Adherence, Scratch testing.
INTRODUCTION
To take advantage of the remarkable mechanical and thermal properties of diamond, many research teams deposit diamond type layers on supports such as the coating on cutting tools, etc. The difficulty is to create the thermal conditions for existence of the diamond phase out of equilibrium (at low pressure). Diamond is formed only in extreme conditions of temperature and pressure.
224 |
Scratching of materials and applications |
The artificial diamond synthesizers make diamond grow in conditions out of thermodynamic equilibrium so that, locally, the parameters of diamond formation are favored compared with those which lead to graphite formation. During the deposition phase, there is always graphite which settles in great quantity (98 %) and diamond at a very low rate (< 1%). To consume the deposited graphite, we operate in the presence of a more erosive gas toward graphite (X 1000) than that for the diamond structure, such as hydrogen or oxygen.
Bachmann [1] described on a triangular diagram (Carbon, Hydrogen, Oxygen) the zones likely to favor the diamond structure out of thermodynamic balance for a combination of hydrogen and carbon.
The zone with best practical probability is situated around pure hydrogen with a low carbon concentration. However, in a carbon I oxygen mixture, the growth of diamond is probable in a broad range of concentration for the gas constituting the mixture.
Being placed in zones where the composition of carbon, oxygen and hydrogen is in a favorable ratio, it is possible to obtain diamond crystals or DLC with nanostructure sp3/sp2• The physicochemical and mechanical properties of the coating strongly depend on the sp3/sp2 ratio.
One of the principal requirements for films on the surface of a substrate in the majority of the technological applications is that the film adheres to the substrate. If adherence is insufficient, premature failures may result from detachment of the film by interfacial fractures. Many measurement techniques for thin and hard film adherence have been proposed, among which the techniques of scratching and marking after application of a load are the most widespread.
During scratch testing DLC, we observed practically the same figures of damages as those on a brittle solid bulk like glass; therefore, we considered it useful to compare the surface damage phenomena ofDLC with that of glass. We performed experimental and theoretical tests on these two materials to better understand the surface cracking ofDLC during scratching. The modeling of the stress fields in solid bulk enabled us to explain the mode of initiation and propagation for cracks in DLC coatings.
Many studies of the contact mechanics have been published since Hertz established the theory of elastic contact for isotropic materials. Concerning the punch/plane indentation, the stress field was solved by Barquins and Maugis [2]. The determination of a stress field for a spherical contact sliding on a plane was established by Hamilton and Goodman [3]. With regard to brittle materials, Lawn [4], Mouginot [5], Mathia [6] and Zeng [7] studied cracking during a spherical indentation. In addition, Lawn [4] and Frank [8] used the energy criterion of Irwin to anticipate the points of crack initiation during scratching. In a sliding contact, where low friction coefficient is involved, these cracks propagate in front of the indenter, forming opened rings wrapping the contact zone [4].
EXPERIMENTAL EQUIPEMENT
The coating adherence characterizes the mechanical resistance of the interface between the coating and the material on which it is deposited. Currently, the only test possible where a quantitative measure of adherence (critical load) is obtained involves the destructive test of scratching.
Damage identification of DLC coating by microscratch test |
225 |
The scratch tests were carried out on the Teer Coatings ST-3001 scratch tester equipped with sensors for normal and tangential forces, and an acoustic detector to visualize the nucleation and propagation of cracks. The system is also equipped with a microscope for observing each event on the scratch according to the fiiction tangential force signal or the acoustic signal.
On glass, the scratch test is carried at length of 10 mm, at the relative displacement speed of 10 mrnlmin under progressive normal load. The loading rate during a test is 110 N/min. The indenter was a Rockwell C 0.8 mm. The glass used was ordinary glass soda lime of dimension 3cm x 3cm x 1cm with Young's modulus E = 60 GPa.
The DLC specimen was deposited on stainless steel 304L (2cm x 2cm) in a PVD reactor with Ci4-Hz gas mixture. The chosen deposition parameters during the growth tests are: temperature 800 °C, gas pressure 30-40 mBar, total flow rate 300 cm3/s, the gas ratio CH.JH2 = 1.5 % and time deposition is I hour. The substrate was polished to roughness Ra = 13 nm by diamond powder. The coating thickness measured by scanning electronic microscopy (SEM) is 3 Jtm. The applied load varies from 5 N to 55 N, the loading rate is 100 N/min and the displacement speed of the specimen is 10 mm/min. The indenter is the Rockwell C 0.2 mm.
EXPERIMENTAL RESULTS
Scratching on bulk glass
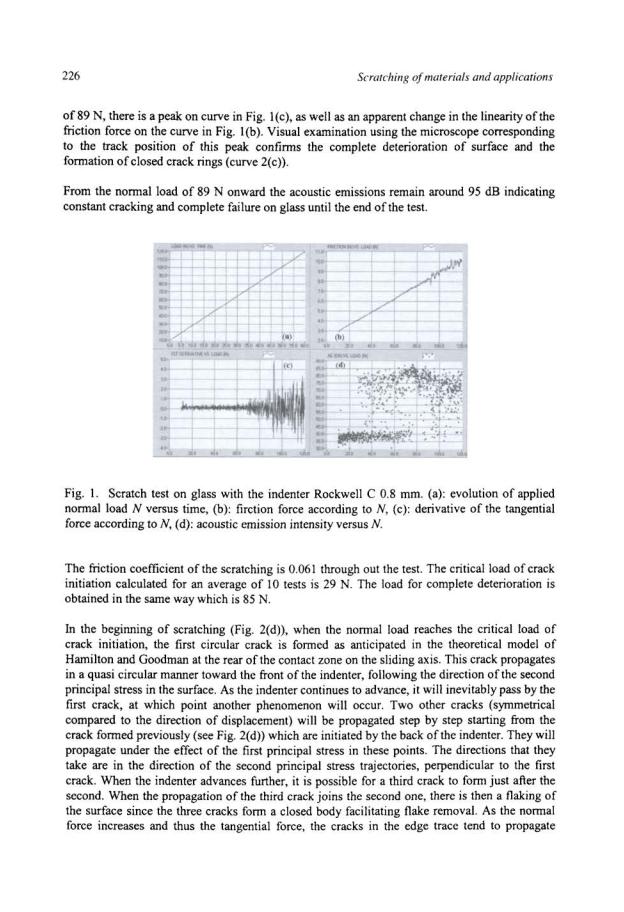
The experimental results relating to the scratching on glass are shown in Fig. 1. Curve in Fig. l(a) gives the evolution of the normal load in time, curve in Fig. 1(b) corresponds to the tangential force during the sliding according to the normal load, curve Fig. 1(c) is the derivative of the tangential force according to the normal load, and the curve Fig. 1(d) corresponds to the acoustic emission during scratching with respect to normal load.
The rupture or the flaking of glass (on the surface) leads to a discrete acoustic emission with high amplitude produced by strong release of elastic energy stored. The process is followed recording of the associated acoustic emission which allows determination, in a more reliable way, the points corresponding to failure.
According to the curve in Fig. 1(d), we note that at the beginning of the test, the acoustic emission is around 40 dB. This noise corresponds to the background noise of the scratch tester to which the noise of the sliding is added. Around a normal load of 30 N, there is a rise in the curve reaching the value of 85 dB. This abrupt increase suggests the beginning of deteriorations in glass. On the other hand, at this stage, the curve in Fig. 1(b) does not yet show a notable change in the fiiction force. We do not observe a variation in the derivative of the fiiction force (curve in Fig. l(c)) for the load of30 N.
The critical normal load is related to the abrupt rise in the acoustic emission. This critical load is determined by visualization of the scratch, using a microscope. We find the position of the crack and get the corresponding load by direct observation (Fig. 2(a)) and (Fig. 1). Experimental results give a load of 30 N for the first damage corresponding to a pressure of 8 GPa in the center of the contact zone.
As the normal load increases, the curves in Fig. 1(b) and 1(c) show increased fluctuations. Indeed, the damages tend to be more important with increasing normal load. From a normal load