

книги / FISMA and the risk management framework the new practice of federal cyber security
..pdf98 |
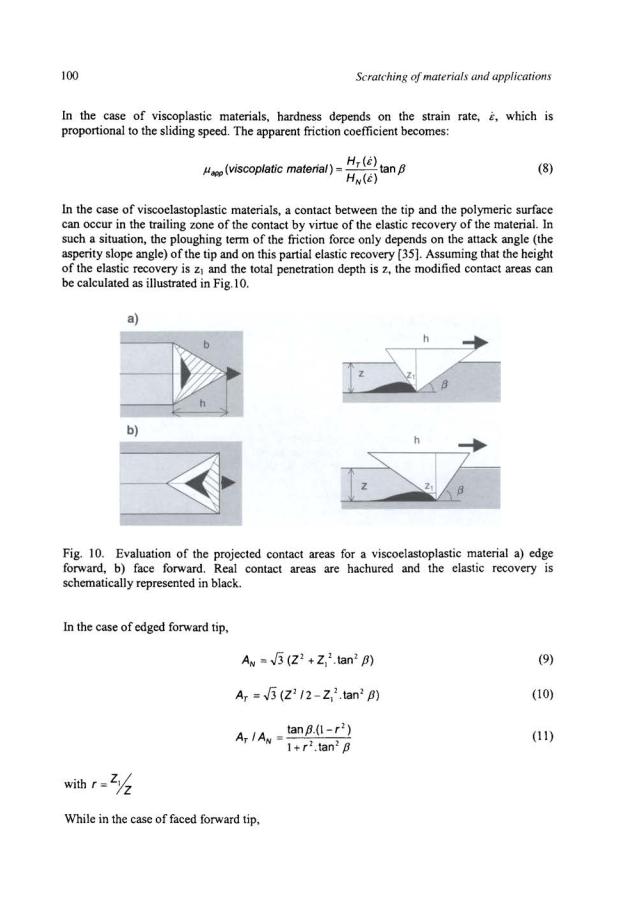
Scratching of materials and applications |
CONCLUSIONS
An investigation of the wear ofpoly(amide) 6 fibres at the nanometre scale was performed by nanoscratch experiments between a single fibre and a trigonal indenter using a Surface Force Apparatus. The nanomachining of the polymeric surface resulted in the plastic flow of the material and did not imply any material loss at this scale. This difference with the abrasive processes observed at the macroscopic scale was tentatively attributed to the much lower strain rates achieved during nanoscratching. Although the nanomachining process did not induce significant changes in the polymer mechanical properties, it modified the surface dissipative and/or adhesive properties. Energetic calculations showed that a major part of the frictional energy was dissipated by interface frictional process.
Nanoscratch experiments clearly demonstrated that the apparent friction coefficient did not follow the Coulomb's laws since they gave strong evidence of a correlation between the indenter penetration, the sliding speed and the tangential force. In spite of complex interactions between bulk viscoplasticity and interfacial friction, it was possible to determine the relative contributions of these processes to the measured friction coefficient, even if the stationary friction regime was not completely achieved. Whereas the viscoplasticity, a time accommodated process, was preponderant during pile-up formation, the interfacial friction became prevalent beyond one contact half length, after formation of the pile-up. During this stage, changes in the sliding velocity were accommodated within a characteristic length of about 50 nm, independently of the sliding speed. This accommodation length was attributed to the rheology of the interface zone.
These effects linked to the friction dynamics have been observed for different systems, from dry contacts to lubricated ones, but remain hardly understood. However, despite the prior work to explain the friction phenomenon in terms of the mechanics of relative motion of rough surfaces in contact, only sporadic attention has been paid to the question of friction as a dynamical process evolving in the contact. The need for such an understanding is becoming now more urgent than ever since it is crucial for the knowledge and control of systems that involve rubbing elements, from machines to earthquakes.
REFERENCES
1.Bowden, F.P. and Tabor, D. (1951). Friction and lubrication of solids. Oxford University Press, London.
2.Baumberger, T., Berthoud, P. and Caroli, C. (1999) Phys Rev B 60,3928.
3.Briscoe, B.J. (1998) Tribology Int. 31, 121.
4.Lancaster, J.K. (1973) Plastics and Polymers 12,297.
5.Briscoe, B.J., Delfino, A. and Pelillo, E. (1999) Wear 225-229, 319.
6.Williams, J.A. (1996) Tribology Int. 29, 675.
7.Rabinowicz, E. (1965) Friction and wear ofmaterials. J. Wiley and Sons.
8.Gauthier, C., Lafaye, S. and Schirrer, R. (2001) Tribology Int. 34, 469.
9.Georges, J.M., Tonck, A and Mazuyer, D. (1994) Wear 175,59.
10.Bureau, L. (2002) PhD Thesis, Universite Paris VII, France.
11.Baumberger, T. (1997) Solid State Communications 102, 175.
12.Bureau, L., Baumberger, T. and Caroli, C. (2002) Eur Phys J E 8, 331.
Nanoscratch and interfacial friction ofpoly(amide) fibres |
99 |
13.Mazuyer, D., Tonck, A., Bee, S. and Loubet, J.L. (2001) In: Nanoscale surface rheology in tribology. Tribology Series, Tribology Research : From model experiment to industrial problems. 39 pp. 273-282. Elsevier, Oxford.
14.Briscoe, B. (1992) Friction of Organic Polymers, Fundamentals of Friction: Macroscopic and Microscopic Processes. Singer and Pollock Editors.
15.Briscoe, B. (1981) Tribology Intemational14, 231.
16.Georges, J.M. (2000) Frottement, usure et lubrification. CNRS Editions, Paris.
17.Bucaille, J.L., Felder, E. and Hochstetter, G. (2001) Wear 249,422.
18.Lafaye, S. (2002) PhD Thesis, Universite de Strasbourg, France.
19.Tonck, A., Bee, S., Mazuyer, D., Georges, J.M. and Lubrecht, A.A. (1999). Proc Instn Mech Engrs 213 Part J, 353.
20.Penning, J.P., Van Ruiten, J., Brouwer, R. and Gabrielse, W. (2003) Polymer 44, 5869.
21.Bukosek, V. and Prevorsek, D.C. (2000) Int J Polymeric Mater. 41, 569.
22.Prevorsek, D.C., Harget, P.J., Sharma, R.K. and Reimschuessel, A.C. (1973) J
Macromol Sci Phys B8, 127.
23.Cayer-Barrioz, J., Tonck, A., Mazuyer, D., Kapsa, Ph. and Chateauminois, A. (2005) J. Polym. Sci: Part B: Polym. Phys. 43, 264
24.Bee, S., Tonck, A., Georges, J.M., Georges, E. and Loubet, J.L. (1996) Philosophical Magazine A 14, 1061.
25.Briscoe, B.J., Sebastian, K.S. and Adams, M.J. (1994)J Phys D: Appl Phys 21, 1156.
26.Odoni, L. (1999) PhD Thesis, Ecole Centrale de Lyon, France.
27.Hernandez, R.J. and Gavara, R. (1994) J Polym Sci: Part B: Polym Phys 32,2367.
28.Kohan, M.L (1995) Nylon plastics handbook. Hanser, Munchen.
29.Stuart, B. and Briscoe, B.J. (1995) Polym Int 38, 95.
30.Valentin, D., Paray, F. and Guetta, B. ( 1987) J Mater Sci 22, 46.
31.Kato, K. (1997) In: Wear mechanisms: Proceedings of the 151 World Tribology Congress. pp.39-56. Mechanical Engineering Publications.
32.Cayer-Barrioz, J., Mazuyer, D., Kapsa, Ph., Chateauminois, A. and Bouquerel, F. (2003)
Wear 255, 751.
33.Cayer-Barrioz, J., Mazuyer, D., Kapsa, Ph., Chateauminois, A. and Robert, G. (2004)
Polymer 45, 2729.
34.Bureau, L., Baumberger, T., Caroli, C. and Ronsin, 0. (2001) CR Acad Sci 2(IV), 699.
35.Cayer-Barrioz, J. (2003) PhD Thesis, Ecole Centrale de Lyon, France.
APPENDIX: An Estimate of the Ploughing Component of Friction for Various Materials When the adhesive component can be neglected, Eq. (1) becomes:
HrAr |
(6) |
flapp "' flploughing = ~ |
N N
In the case of plastic materials, for a trigonal indenter, the contact areas are calculated from the tip penetration depth and the attack angle, p, of the sliding indenter [6]. The ratio of the contact areas is then purely geometric and only depends on the attack angle. As a consequence, for a purely plastic material, the apparent friction coefficient is:
f1 app (plastic material) = !!.I_ tan f3 |
(7) |
HN

Nanoscratch and inteifacial friction ofpoly(amide) fibres |
101 |
..fi |
2 |
|
|
|
|
|
|
|
tanp~27 2 |
2 |
2 ~zz |
) |
(12) |
||||
AN = - 2 |
+Z |
1. -- . |
(-.Z +9.Z1 |
.tan |
P-9v2 . 1.tanp |
|
|
|
2 |
|
3 |
2 |
|
|
|
|
|
|
Ar = z (Z- zl ).M |
|
|
|
|
(13) |
||
|
|
|
|
|
|
|
|
(14) |
Therefore for viscoelastoplastic materials at a constant sliding speed, the apparent friction coefficient remains constant with the sliding distance, once the stationary friction is achieved:
J.lapp(viscoelastoplastic material)= f(ZpZ./J,Hr ,HN) |
(15) |
These calculi show that the friction component due to ploughing is only dependent on the attack angle and on the elastic recovery ofthe material.
102
CHAPTERS
METROLOGY FOR CHARACTERIZING THE SCRATCH RESISTANCE OF POLYMERIC COATINGS THROUGH OPTICAL SCATTERING
LI-PIIN SUNG 1·',PETER L. DRZAL2, MARK R. VANLANDINGHAM3,
and AARON M. FORSTER 1
1National Institute ofStandards and Technology, Building and Fire Research Laboratory, 100 Bureau Dr, Mail Stop 8615, Gaithersburg, Maryland 20899-8615
2PPG Industries, Inc., Resin and Coatings Research and Development,
4325 Rosanna Drive. Allison Park. Pennsylvania, 15101
3Multifunctional Materials Branch, U.S Army Research Laboratory,
Aberdeen Proving Ground, MD 21005-5069 *E-mail: lipiin.sung@nist.gov
ABSTRACT
Scratch and mar resistance is an attribute of great practical importance to polymeric materials. Physical measurements of scratch and mar resistance have been conducted, but the ability to link these resistance to other properties of a polymer and to the customer-perceived appearance of a surface has remained elusive. Thus, optimization of material properties enhancing scratch and mar resistance is not possible. Over the years. a multitude of scratch test devices and protocols has been developed, but the large amount of data generated has made it very difficult to compare and pool data, and ultimately to standardize any test protocol. Also, the relevancy of physical measures of scratch and mar are continually being raised, since a link between physical measurements of scratch and mar and consumer perceived failure caused by scratch and mar has not been established. Establishing a connection between physical and appearance characterizations of scratch and mar are difficult, since appearance measures of scratch and mar are almost always based on qualitative, as opposed to quantitative, assessments of damage. These appearance measurements are made through visual inspection, gloss changes, and changes in gray scale level or lightness. These qualitative assessments are seldom either repeatable or reproducible, and thus a reliable standardized test method for assessing scratch and mar from a consumer's perspective is also not currently available to the polymeric materials community.
In this chapter, progress is reported toward the development of a scientifically based standardized test method for quantifying scratch resistance based on optical scattering metrologies. A scratch protocol to impart a standard scratch deformation is described. Optical scattering measurements are conducted to identify the onset of plastic deformation by analyzing specular and off-specular intensities. The angular-resolved optical scattering reflectance profiles at various incident angles are measured using a custom-designed optical scattering instrument at the National Institute of Standards and Technology (NIST). Angular-resolved optical scattering from surfaces having a single or multiple scratches are compared to gloss measurements taken
Metrology for characterizing the scratch resistance ofpolnneric coatings |
103 |
at 20° and 60° with a commercial glossmeter. By analyzing the specular and off-specular scattered intensities, scratch damage can be quantitatively assessed, even when the results from gloss measurements are indistinguishable. Additionally, the correlation between surface roughness and gloss measurements is presented. Finally, there is commentary herein on future research directions that includes implementing metrologies for linking appearance-based scratch resistance measurements to nanomechanical material properties measured through instrumented indentation.
KEYWORDS
Appearance, gloss, laser scanning confocal microscopy, mechanical properties, optical scattering, scratch and mar, surface morphology
INTRODUCTION
Damage to the appearance of polymeric materials by surface deformation, such as a finger nail scratch or gouge, remains a major challenge for commercial applications of these materials. As a result, considerable scientific and engineering efforts have been expended to assess, improve, and predict the appearance durability or "scratch resistance" of plastic materials. Typically, surface deformation that negatively affects appearance can be categorized as either scratch or mar. Marring usually occurs under less severe conditions compared to scratching, and the depth of mar damage is less than that of a scratch. Scratching, on the other hand, is associated with a much lower density of larger, deeper scratches, sometimes even a single scratch. In both cases, the result is a decrease in the appearance of the polymeric surface, the extent of which qualitatively depends on a customer's perception of what he or she considers a defect.
To understand scratch and mar damage, a number of commercial and custom instruments have been developed to impart scratch or mar damage. These instruments can be quite sophisticated, providing instrumented signals such as displacement, scratching force, frictional force, and many others. Coinciding with many of these instruments [1-7] are numerous test methods to quantify or rank the scratch resistance of polymeric materials. The wide variety of scratch methods and instrumentation presents many challenges in the standardization of a scratch protocol, because the same material scratched under different tip geometries, normal force, and velocity will give dramatically different damage morphologies. Equally difficult to standardize is the assessment and measurement of scratch resistance. Scratch resistance is commonly measured by assessing appearance changes brought about by scratch damage. Scratch damage can range from plastic grooving in a ductile material, to cracking and chipping in a brittle material. The severity of the scratch appearance will not only depend on the damage morphology of the scratch region but also on other variables such as surface roughness, color of the plastic part, and index of refraction of the surface. Therefore, a scratch resistance ranking methodology based on a single damage event, like cracking, does not adequately capture the materials resistance to scratch visibility.
In the coating industry, specular gloss measurements using commercially available glossmeters remain the mainstream measurement tool for assessing the appearance and durability of coated objects. Commercial glossmeters can be used to measure the change in gloss (decrease in specular reflection) due to scratch or mar damage occurring in laboratory or field testing of a
104 |
Scratching of materials and applications |
material. As will be demonstrated, specular gloss measurements have significant limitations relative to assessing scratch and mar damage. For example, a severe scratch or damage from multiple scratches on a coating surface results in a strong suppression of the specular gloss. A commercial glossmeter is only sensitive to the overall reduction in specular gloss and not the underlying scratch morphology that actually reduced the gloss value.
Additional assessment methods such as gloss change, change in gray scale level, or lightness have been created as useful adjuncts to visual inspection to help distinguish between two highly damaged surfaces. However, these techniques often provide only a relative answer, such as whether the surface is scratched or not. For example, a single scratch in a coating or surface produces only a slight change in specular scattering, but it produces a large increase in diffusive scattering intensity (off-specular). Commercial glossmeters, gray scale level, or lightness measurements are not sensitive to these minute decreases in specular gloss nor are they sensitive to the rise in diffusive scattering intensity. Thus, specular techniques cannot be used to quantitatively describe the scratch damage morphology and its resulting scratch visibility for a single scratch surface.
More quantitative approaches, such as described in a recent study by Rangarajan et al. [8], have used optical imaging techniques to quantify the optical contrast of a scratch on a glossy polymer surface. The total optical contrast was a function of scratch dimensions and the contrast in both specular and off-specular scattering. Therefore, it provided a more robust measurement of the relationship between damage and visibility. Similarly, a strong correlation between the total optical contrast and scratch visibility was proposed by the industrial appearance perception study [9]. However, this study did not include discussion of the relationships between scratch appearance and the material properties or surface characteristics (e.g., elastic modulus, frictional coefficient, yield stress, and surface roughness). A full angular-resolved optical scattering profile along with characterization of the surface mechanical properties is needed to fully understand the structure-property relationships that govern the scratch durability over time.
Currently, relationships between appearance attributes and surface deformation associated with scratching and marring are ambiguous. This lack of connectivity is one of the major barriers to the development and acceptance of standard measurement techniques for determining scratch and mar resistance. In order to successfully implement a scientifically based standardized test method for quantifying scratch resistance, it is vital to understand the relationships between material/mechanical properties, morphology, and appearance (optical properties) of surface and sub-surface deformation. A three-step methodology is proposed to provide the information required to draw conclusions about structure-property relationships that govern scratch resistance. A scratch is first generated in a material using a well-controlled scratch measurement protocol [I 0]. Second, an optical imaging technique is utilized to identify the "onset" of plastic deformation. At this point, the onset may be linked to the mechanical properties. Finally, the scratch damage is characterized with respect to the background signal from the undamaged surface by measuring both the specular and off-specular scattering intensities. The ratio of these two scattering signals includes information on surface roughness, substrate color, incident wavelength, and angle, and is used to evaluate the visibility of the scratch. The combination of absolute physical and optical measurements permits the quantitative evaluation of scratch resistance for each material. Therefore, we may objectively relate performance (durability, appearance) to material/mechanical properties.

Metrology for characterizing the scratch resistance of pol\'meric coatings |
105 |
This chapter describes an optically-based scratch test methodology developed through a National Institute of Standards and Technology (NIST) partnership with industry (Polymer Interphase Consortium (PIC)) and its application to a series of model polymeric materials. The reader is expected to gain a better understanding of (1) how scratch variables like tip geometry, scratch speed, and method of force application (constant or progressive) influence the onset of scratch visibility, (2) the contribution of surface roughness to scratch visibility, (3) the importance of off-specular scattering and the limitations of specular gloss measurements, and
(4) the effect of multiple scratches and a single-scratch on surface appearance.
EXPERIMENTAL SECTION*
Materials
Materials used in this study included a set of model amine-cured epoxy (EP, prepared at NIST) coatings, 2 component polyurethane clear coatings (PU, provided by PPG), black pigmented poly(methyl methacrylate) (PMMA, a commercial product), and black pigmented highly crystalline poly(propylene) (PP, provided by Dow Chemical). A brief description of sample preparations along with mechanical characterization is described below.
Influence of Roughness: A set of epoxy (EP) coatings, each having a different surface roughness, were fabricated to study the link between surface morphology and optical reflectance properties such as gloss [11,12]. The epoxy coatings were cast between a smooth black glass substrate (Schott Glass NG-1, 3 mm thickness) and a mold embossed with a well-characterized surface roughness. Mold fabrication and sample preparation details are reported elsewhere [11]. The final coatings, designated as EP15 through EP45, had decreasing RMS roughness values ranging from 800 nm (EP15) to 100 nm (EP45), as estimated from mechanical (stylus) profiling data [13].
Multiple Scratch Visibility: Two different polyurethane clear coat formulations (PU-A and PU- B, coating thickness :o::40 ).1m, prepared by PPG) were cast on NG-1 black glass substrates. Multiple scratches were generated on the cured coatings using 5 cycles from an AMTEC Kistler (AK) scratch tester (performed by PPG). Non-scratched polyurethane samples were also prepared for reference.
Single Scratch Visibility: Injection-molded plaques of highly crystalline poly(propylene) (PP) (3 mm thickness) were provided by Dow Chemical. Poly(methyl methacrylate) PMMA samples (3.8 mm thickness) were obtained from a commercial source. An instrumented indentation and scratch testing system (MTS Nanoindenter XP equipped with lateral force measurement - instrument described elsewhere [14]) was used to create and characterize single scratches on these materials. Scratch tests were performed at NIST using 45° semi-apical angle diamond cone indenters with tip radii of 1 1-1m and 10 J.lm. Scratches were generated by either progressive-force or constant force scratch methods. In a progressive force scratch test, the applied normal force linearly increases over the length of the scratch to a maximum applied force. In a constant-force scratch test, the applied normal force is maintained at a constant value over the length of the scratch. Regardless of the test method, the scratch and residual depths,
Certain instruments or materials are identified in this paper in order to adequately specify experimental details. In no case does it imply endorsement by NIST or imply that it is necessarily the best product for the experimental procedure.

106 |
Scratching of materials and applications |
friction coefficient, and residual roughness are measured during scratch testing. Scratch lengths were either 500 1.1m or 1000 1.1m.
For all testing, the samples described above were used as received, with no further annealing or modification. A representative indentation modulus was obtained for each material using an MTS DCM Nanoindenter, and the results are listed in Table 1.
Table 1: Modulus values of samples measured using a MTS DCM Nanoindenter and evaluated at an indentation depth of 1 !liD· Each average modulus value is followed by a ± symbol and another value representing plus or minus one standard deviation (k = 1), estimated from 10 individual indentations.
EP-Series
4.16 ± 0.06
PMMA 5.11 ± 0.08
Surface Roughness and Scratch Morphology Characterization
A Zeiss model LSM51 0 reflection laser scanning confocal microscope (LSCM) was employed to characterize surface morphology (topographic profile) and scratch damage. A detailed description of LSCM measurements can be found elsewhere [15, 16]. The laser wavelength used in this study was 543 nm. LSCM images presented in this paper are 2D intensity projections (an image formed by summing the stack of images over the z direction, 512 pixel x 512 pixel), or 3D topographic profiles of the coating surface. The 2D intensity projection images are effectively the sum of all the light scattered by different layers of the coating, as far into the coating (approximately 100 1.1m in the 5X configuration) as light is able to penetrate. The pixel intensity level represents the total amount of back-scattered light. Darker areas represent regions scattering less light than lighter colored areas. Figure 1 shows an example of
(a) epoxy coating surface morphology, and (b) a scratch profile generated by a constant-force scratch test method. The scratch width was defined as the peak-to-peak distance perpendicular to the scratch length, and is indicated in Figure lb.
The Root-Mean-Square (RMS) surface roughness Sq is calculated using a surface tilt correlation across an automatic plane fit of the 3D topographic image. The plane fit is a single polynomial fit to the intensity data across the image. The polynomial fit is subtracted from the image to remove any tilt in the image. Since the subtraction occurs over the entire image, the plane fit does not corrupt the topographic data. The RMS surface roughness is calculated without a numerical filter according to the following formula:
(1)
(2)
Here, N,, Ny indicate the number of pixels in X- and Y-directions. Estimated uncertainties of roughness measurements were one standard deviation from the mean determined from 5 different locations on each sample