

книги / FISMA and the risk management framework the new practice of federal cyber security
..pdf168 |
Scratching of materials and applications |
A technique of using a modified Scanning Probe Microscope (SPM) to study tribological properties of mild-steel with and without lubricant and clutch frictional material in automotive transmission fluid was developed in the early 90s [17, 18], as well as to measure the micro mar resistance of surface coatings quantitatively [19, 20].
In the commercial SPM, the spring constant of the probe ranges from 0.06-0.58 N/m [2 I]. In the modified SPM, the probe was replaced by a customized probe, in which a diamond shard in micrometer size, picked from a smashed diamond chip, was glued, using epoxy, to a rectangular-shaped cantilever made of a tungsten foil of 12.7, 25.4, or 50.8 ~m thick. The spring constant of the customized probes is three to four orders of magnitude larger than the commercial one, which is capable of making artificial mars similar to the mars encountered in the real field. Thus, it can be used to measure micro mar resistance (MMR) and different responses of coatings to the marring stress, i.e., elastic recovery, plastic deformation, and abrasive wear, quantitatively [22]. The detailed procedure of the measurement will be described in the following sections.
Since the shape of the shard was not predictable and reproducible, the test results were only good for comparison of coatings tested with the same tip and under the same conditions. With the rapid development of nanotribology, the commercial micro diamond tips with well-defined shapes, conical or three or four faced pyramid-shaped, became available in the second half of the 1990s [23]. They were used to replace the shard in the customized probes [24, 25].
While great achievements were made with the modified SPM, designed originally for nondestructive imaging, limitations were encountered. The force generated by deflecting the customized cantilever was limited to a few milli-newtons, and the penetration depth was limited to a couple of micrometers, the z range of the scope, which was not enough for study of some specimens. As the demand for new instruments grew, a new generation of nano indenter/scratcher appeared [26]. A Nano-lndenter XP, made by MTS System Corp., was acquired in the late 90s. The indenter can perform both nanoindentation and nanoscratch tests with a single head, with a normal force up to 650 mN and a penetration depth up to 2 mm. It has greatly enhanced the capability of carrying out tribological measurements in a much larger range. The Nano-indenter can scratch the tested surfaces under a constant, increasing, or incremental load, and the SPM is used to examine the damaged surfaces and analyze the marring/scratching mechanism [27].
Before the test, the samples will be washed in an ultrasonic bath with a mild solvent-free detergent, rinsed in a stream of cool tap water, gently dried with a soft tissue, and then blown dry with high-pressure nitrogen gas to remove any dust and grease on the surface.
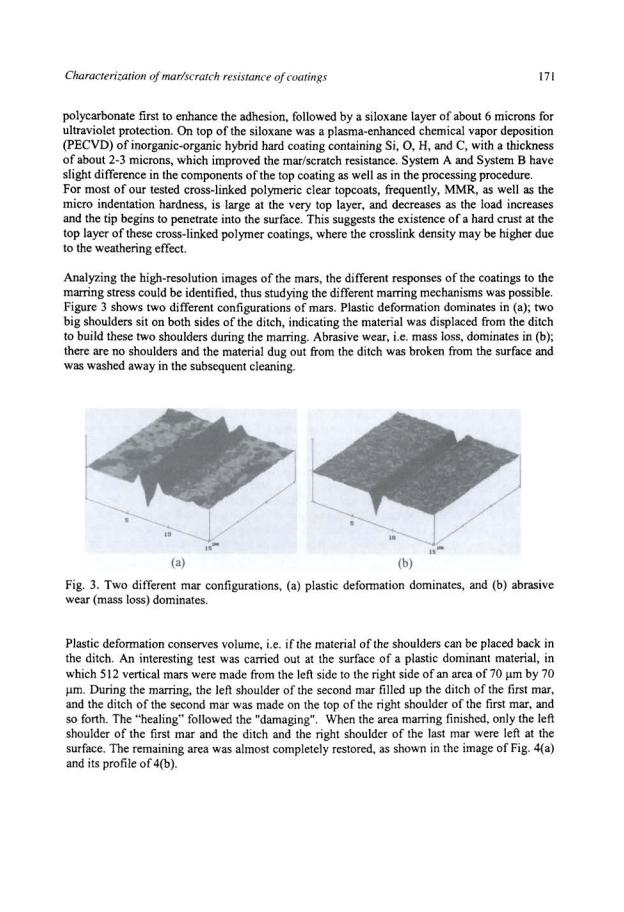
During the scraping, as the normal force applied to the indenter increases, the mar gets deeper and wider, and a fairly neat mar may become a rough trough; cracks, delamination and chipping may also take place. The damages that the most coatings suffered in the practical applications can be roughly classified into five different modes; mar, rough trough, cracking, delamination, and chipping. Depending on the properties of the coatings and the application conditions, tested coatings may or may not show all the five modes. The combined use of nano-indenter and scanning probe microscope allows measurement of critical force for rough trough, at which point the mar switches to the rough trough, as well as critical forces for cracking, for delamination, and for chipping, if any, with good accuracy. These measured critical forces, along with the micro mar resistance, give a full spectrum of mar/scratch resistance behavior of tested samples.
Characterization of mar/scratch resistance of coatings |
169 |
To further comprehensively evaluate mar/scratch resistance of a material in a specified application, thus directing the development of new high mar/scratch resistant material for the application, introduction of a quantitative index is very useful. The index depends on the properties of the material as well as on the application environment. Intense study of the samples, which have been used in the application environment, investigating the application conditions, and determining their equivalent laboratory test conditions, is a necessary first step. This is followed by quantification of damages made by different scratching modes, by using a Haze-gard plus instrument, which will be described in the section of Quantitative Index. Samples with mars, rough troughs, cracks, delamination, and chipping on the surfaces are evaluated by the instrument for the haze level increases caused by these different damage modes. Then, such a quantitative index can be calculated, either through summation or through integration, which is useful in developing new materials and avoiding a time-consuming field test.
Due to the variety of the materials and various requirements in their applications, the micro mar resistance and critical force measurement may not be adequate for characterization of all of them. Some alternate test methods will also be discussed, including crack density measurement, repeated scratching test, and cross-scratching test.
The present paper is focused on the introduction of mar/scratch resistance characterization techniques, not on the chemistry of the coatings/materials or the tribological properties of specific samples.
MAR RESISTANCE MEASUREMENT
Mar resistance is a complicated issue, and it cannot be characterized with a single quantity. The test results vary with the applied load during the scraping, penetration depth of the tip, and other marring conditions. A Nano-indenter, made by MTS Systems Corp., equipped with a 90° conical-shaped diamond tip with a radius of I or 2 jlm at its apex is used to scrape the surface of the sample in the majority of our tests. The indenter can scratch the surface under pre-selected conditions for a distance up to 30 mm at a scraping speed up to I0 mrn/s.
In performing the scratching, the tip first makes a pre-scan under a light load of about I0 j.!N or less to measure the surface profile along the line to be tested. The surface profile is stored and used to automatically correct subsequent data. During the scratching procedure, lateral motion, applied load, real-time penetration depth, and the frictional force encountered by the tip are recorded. Following the scratching, the tip will make a post-scan to measure the residual depth ofthe scratch. Curves of applied load, real-time penetration depth, residual depth, and frictional force versus the lateral movement of the tip can be plotted.
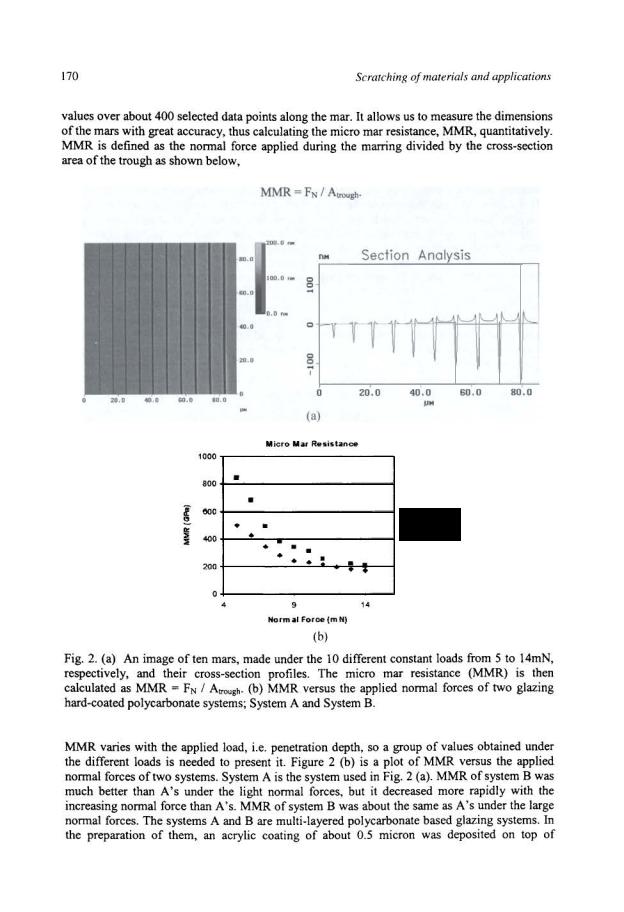
In the mar resistance measurements, the Indenter will scrape the surface under five to ten preselected different constant loads, before the mar switches to the rough trough, for a distance of 100-150 jlm at a speed of 10-20 j.!rnls. It produces a group of five to ten parallel mars, made under the different loads, with a pre-selected spacing of I0-15 jlm on the surface. After the marring, the sample will be washed again, but without the detergent, to remove any broken material, then the mars will be examined with the SPM. Figure 2 (a) shows an image of ten mars at the surface of a hard-coated polycarbonate system, a candidate for automobile windows, made under the 10 different constant loads from 4 to l5mN, respectively, and their cross-section profiles. The plot of the profiles is made by the software in the SPM, based on the average
Characterization of mar/scratch resistance of coatings |
173 |
Apen: |
Cross-section area of penetration |
|
|
during scratching |
|
A.lit: |
Cross-section area of residual ditch |
|
Ashs: |
Cross-section area of two shoulders |
|
Atrgh: |
Cross-section area of trough |
|
Micro Mar Resistance: FN I Atrgh |
||
Elastic Recovery: |
(ApenAdit) I Apen * % |
|
Plastic Deformation: Ashs I Apen * % |
||
Abrasive Wear: |
(A.IitAshs) I Apen *% |
|
Fig. 6. Illustration of how to calculate the micro mar resistance (MMR) and three different responses of coatings to marring stress.
174 |
Scratching of materials and applications |
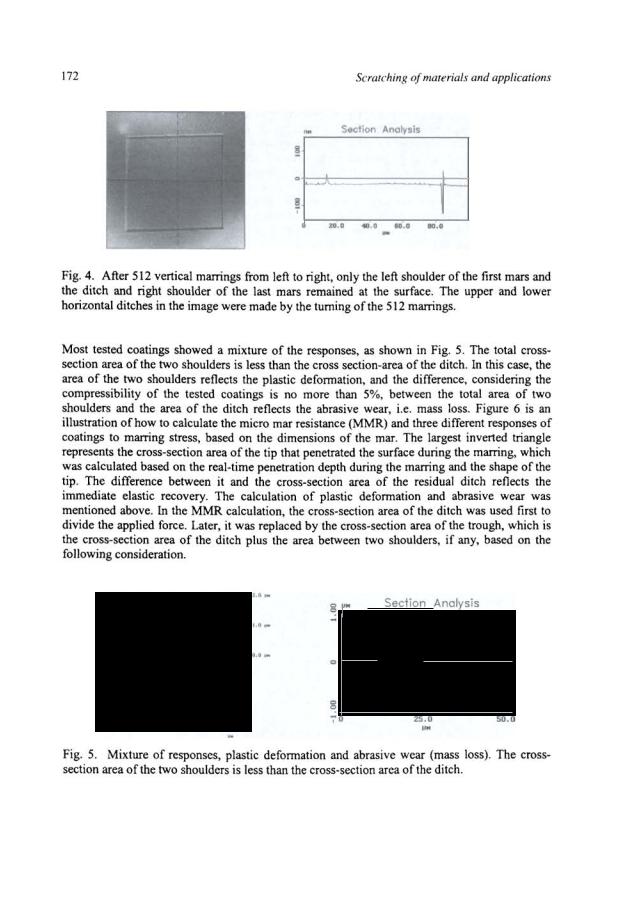
Suppose two mars possess the same size of ditch, but one has two shoulders and the other has none. Due to the larger topographic fluctuation of the surface, the damage of the first sample will be more visible. To make the MMR more consistent with the visual judgment and other optical evaluations, the cross-section area of the trough was used to replace the cross-section area of the ditch in the calculation ofMMR.
A large portion of the tested coatings showed a self-healing to different extents, mainly depending on their glass transition temperature, Tg [28-30]. This is attributed to viscoelastic recovery. Viscoelastic recovery is different from elastic recovery. It results in partial or complete recovery of a marred surface within a time frame from several minutes to several hours [31, 32], while the elastic recovery occurs immediately after the marring tip moves over the surface. A study of viscoelastic recovery using SPM was reported [33], as well as a study of the strain hardening, micro cracking, and surface fatigue [34], using this technique.
Although the Nano-indenter equipped with the diamond tips can make artificial mars/scratches with the dimensions similar to those encountered in the field, the scraping speed is much slower than most scrapings in the real field. The speeds used in the tests are limited by the data-taking rate of the Indenter, which is 5 data points per second. To acquire enough data points of the realtime penetration depth, encountered frictional force, etc. along the scratch for analysis, we keep the scraping speed slower than 20 J.unls in the majority of tests, which is the main limitation of the microand nano-scale measurements.
CRITICAL FORCES MEASUREMENT
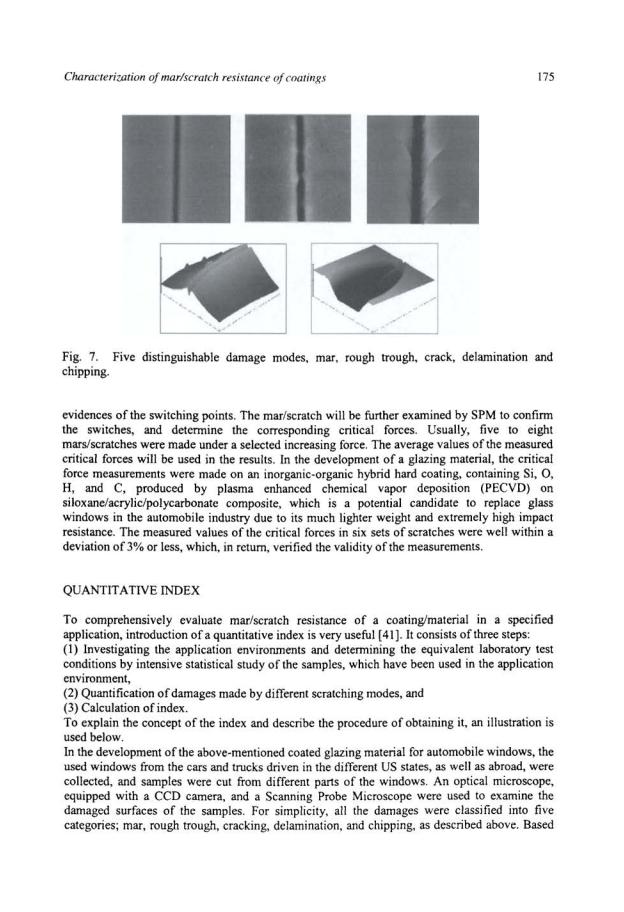
Mar is the light damage, made by the scraping under low normal force. It is usually fairly neat, consisting of a ditch with a smooth bottom and two, if any, well-shaped shoulders on both sides of the ditch. In this stage, the micro mar resistance (MMR) is a reasonable characterization of the coatings' ability to resist small-scale mechanical stresses. Scraping the surface with an increasing normal force, the bottom of the ditch, as well as the ridges of the two shoulders, becomes rough. The neat mar becomes a rough trough. MMR is no longer an appropriate characterization since the cross-section area of the trough, used in the calculation of MMR, begins to change erratically along the rough trough. As the normal force increases further, cracking may occur in the surface of the coatings. Under the continuously increasing normal force, delamination may take place if the penetration depth of the tip reaches the interface and the stress generated by the scraping tip exceeds the adhesion strength. Increasing the force further more may result in the delaminated top layer being chipped off, piece-by-piece, from the surface. Figure 7 shows the five typical distinguishable damage modes, commonly seen in the marring/scratching tests, as well as encountered in the applications [35-38]. Most scratching damages on the surfaces of the coatings used in the real field can be roughly classified into these five modes. Depending on the properties of the coatings, as well as application environments, the coatings may or may not show all the modes.
To characterize the coatings' ability to resist the medium to severe damages, critical forces were used [27, 39, 40]. In the present study, the critical force for rough trough, at which a neat mar switches to a rough trough, as well as the critical force for cracking, for delamination and for chipping, if any, were measured, using the Nano-indenter operated under an increasing normal load. As the damage mode switches to the next more severe mode, the real-time penetration depth, as well as the depth of the residual ditch, becomes rougher, and the frictional force encountered becomes more fluctuated, which provide the

176 |
Scratching of materials and applications |
on the intensive statistical study, the weights of the occurrence of the five distinguishable damages are 75%, 15%, 6%, 3%, and 1%, respectively.
Carrying out a laboratory test with the Nano-indenter and SPM on the material of the used windows, as described above, the measured critical forces for rough trough, for cracking, for delamination, and for chipping were 20, 30, 40, and 50 mN, respectively. Thus, the distribution of the forces encountered by the windows in the real field could be equivalent to the laboratory forces plotted in Fig. 8.
p
0.10 |
|
|
|
|
|
|
|
0.06 |
|
|
|
|
|
|
|
0 06 |
|
|
|
|
|
|
|
0.04 |
|
f ---- .. , |
|
|
|
||
0.02 |
|
|
|
|
|
|
|
o.oo |
|
L_~_ |
~ |
|
|||
|
_.l__.r=.=::J::==-~ |
||||||
|
|||||||
0 |
10 |
20 |
30 |
40 |
50 |
||
|
|
|
|
|
|
|
F(mN) |
Fig. 8. Force distribution plot based on study of a sample, which has been used in the field with the weights of the occurrence of mar, rough trough, cracking, delamination, and chipping being 75%, 15%, 6%, 3%, and 1%, respectively, and its critical forces for rough trough, cracking, delamination, and chipping being 20, 30, 40, and 50 mN, respectively, in the laboratory test.
The area under the line between F=O to F=20mN is 0. 75, i.e., 75%; the area under the line between F=20mN to F=30mN is 0.15, i.e., 15%; and so forth. The total area under the line is 1, i.e., 100%, and the force distribution function P is normalized. Here, an assumption was made for simplicity that the forces distribute uniformly between F=O to F=20mN, distribute uniformly between F=20mN to F=30rnN, and so forth. If the damages are classified into more and more modes, by measuring the weights of occurrence of each mode and their corresponding critical forces, a smooth force distribution curve can be obtained eventually,
P(F)
Fig. 9. Force distribution curve; if we classify the damages into more and more modes, and measure their corresponding critical forces, ideally we will obtain a smooth curve of the force distribution.